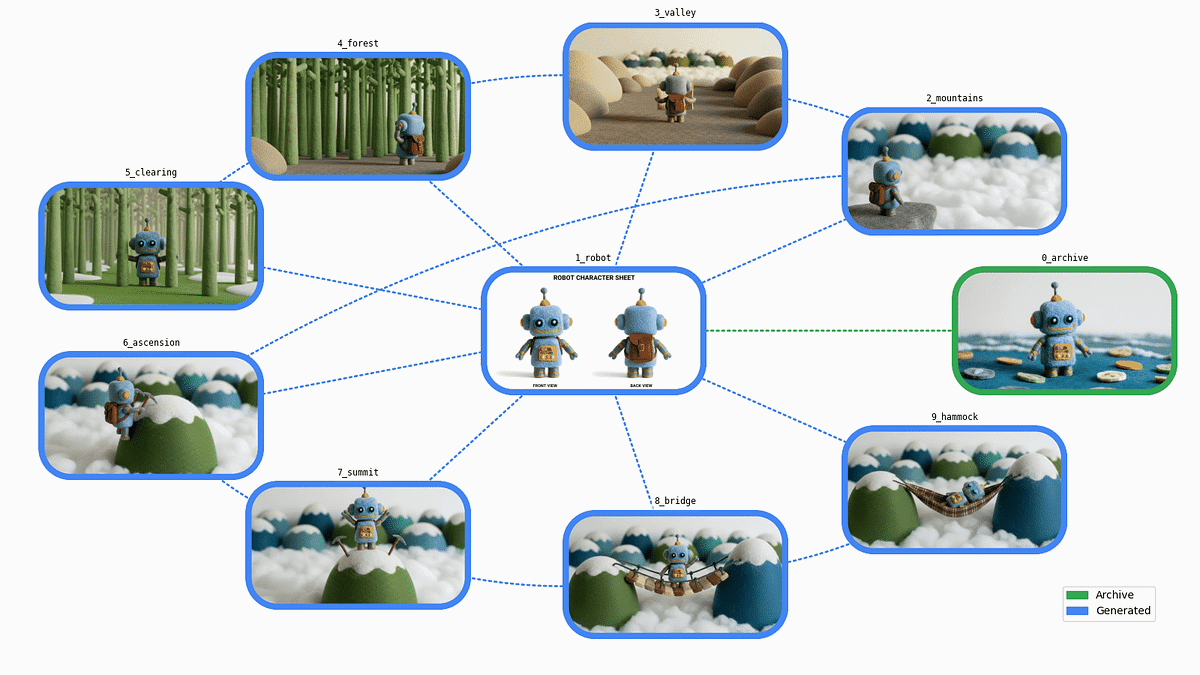
from collections.abc import Iterator
from io import BytesIO
from pathlib import Path
import PIL.Image
import PIL.ImageDraw
from google.genai.types import PIL_Image
from matplotlib.axes import Axes
from matplotlib.backends.backend_agg import FigureCanvasAgg
from matplotlib.figure import Figure
from matplotlib.image import AxesImage
from matplotlib.patches import Patch
from matplotlib.text import Annotation
from matplotlib.transforms import Bbox, TransformedBbox
@enum.unique
class ImageFormat(enum.StrEnum):
# Matches PIL.Image.Image.format
WEBP = enum.auto()
PNG = enum.auto()
GIF = enum.auto()
def yield_generation_graph_frames(
graph: nx.DiGraph,
animated: bool,
) -> Iterator[PIL_Image]:
def get_fig_ax() -> tuple[Figure, Axes]:
factor = 1.0
figsize = (16 * factor, 9 * factor)
fig, ax = plt.subplots(figsize=figsize)
fig.tight_layout(pad=3)
handles = [
Patch(color=COL_OLD, label=”Archive”),
Patch(color=COL_NEW, label=”Generated”),
]
ax.legend(handles=handles, loc=”lower right”)
ax.set_axis_off()
return fig, ax
def prepare_graph() -> None:
arrows = nx.draw_networkx_edges(graph, pos, ax=ax)
for arrow in arrows:
arrow.set_visible(False)
def get_box_size() -> tuple[float, float]:
xlim_l, xlim_r = ax.get_xlim()
ylim_t, ylim_b = ax.get_ylim()
factor = 0.08
box_w = (xlim_r – xlim_l) * factor
box_h = (ylim_b – ylim_t) * factor
return box_w, box_h
def add_axes() -> Axes:
xf, yf = tr_figure(pos[node])
xa, ya = tr_axes([xf, yf])
x_y_w_h = (xa – box_w / 2.0, ya – box_h / 2.0, box_w, box_h)
a = plt.axes(x_y_w_h)
a.set_title(
asset.id,
loc=”center”,
backgroundcolor=”#FFF8″,
fontfamily=”monospace”,
fontsize=”small”,
)
a.set_axis_off()
return a
def draw_box(color: str, image: bool) -> AxesImage:
if image:
result = pil_image.copy()
else:
result = PIL.Image.new(“RGB”, image_size, color=”white”)
xy = ((0, 0), image_size)
# Draw box outline
draw = PIL.ImageDraw.Draw(result)
draw.rounded_rectangle(xy, box_r, outline=color, width=outline_w)
# Make everything outside the box outline transparent
mask = PIL.Image.new(“L”, image_size, 0)
draw = PIL.ImageDraw.Draw(mask)
draw.rounded_rectangle(xy, box_r, fill=0xFF)
result.putalpha(mask)
return a.imshow(result)
def draw_prompt() -> Annotation:
text = f”Prompt:\n{asset.prompt}”
margin = 2 * outline_w
image_w, image_h = image_size
bbox = Bbox([[0, margin], [image_w – margin, image_h – margin]])
clip_box = TransformedBbox(bbox, a.transData)
return a.annotate(
text,
xy=(0, 0),
xytext=(0.06, 0.5),
xycoords=”axes fraction”,
textcoords=”axes fraction”,
verticalalignment=”center”,
fontfamily=”monospace”,
fontsize=”small”,
linespacing=1.3,
annotation_clip=True,
clip_box=clip_box,
)
def draw_edges() -> None:
STYLE_STRAIGHT = “arc3”
STYLE_CURVED = “arc3,rad=0.15”
for parent in graph.predecessors(node):
edge = (parent, node)
color = COL_NEW if assets[parent].prompt else COL_OLD
style = STYLE_STRAIGHT if center_node in edge else STYLE_CURVED
nx.draw_networkx_edges(
graph,
pos,
[edge],
width=2,
edge_color=color,
style=”dotted”,
ax=ax,
connectionstyle=style,
)
def get_frame() -> PIL_Image:
canvas = typing.cast(FigureCanvasAgg, fig.canvas)
canvas.draw()
image_size = canvas.get_width_height()
image_bytes = canvas.buffer_rgba()
return PIL.Image.frombytes(“RGBA”, image_size, image_bytes).convert(“RGB”)
COL_OLD = “#34A853”
COL_NEW = “#4285F4”
assets = graph.graph[“assets”]
center_node = most_connected_node(graph)
pos = compute_node_positions(graph)
fig, ax = get_fig_ax()
prepare_graph()
box_w, box_h = get_box_size()
tr_figure = ax.transData.transform # Data → display coords
tr_axes = fig.transFigure.inverted().transform # Display → figure coords
for node, data in graph.nodes(data=True):
if animated:
yield get_frame()
# Edges and sub-plot
asset = data[“asset”]
pil_image = asset.pil_image
image_size = pil_image.size
box_r = min(image_size) * 25 / 100 # Radius for rounded rect
outline_w = min(image_size) * 5 // 100
draw_edges()
a = add_axes() # a is used in sub-functions
# Prompt
if animated and asset.prompt:
box = draw_box(COL_NEW, image=False)
prompt = draw_prompt()
yield get_frame()
box.set_visible(False)
prompt.set_visible(False)
# Generated image
color = COL_NEW if asset.prompt else COL_OLD
draw_box(color, image=True)
plt.close()
yield get_frame()
def draw_generation_graph(
graph: nx.DiGraph,
format: ImageFormat,
) -> BytesIO:
frames = list(yield_generation_graph_frames(graph, animated=False))
assert len(frames) == 1
frame = frames[0]
params: dict[str, typing.Any] = dict()
match format:
case ImageFormat.WEBP:
params.update(lossless=True)
image_io = BytesIO()
frame.save(image_io, format, **params)
return image_io
def draw_generation_graph_animation(
graph: nx.DiGraph,
format: ImageFormat,
) -> BytesIO:
frames = list(yield_generation_graph_frames(graph, animated=True))
assert 1 <= len(frames)
if format == ImageFormat.GIF:
# Dither all frames with the same palette to optimize the animation
# The animation is cumulative, so most colors are in the last frame
method = PIL.Image.Quantize.MEDIANCUT
palettized = frames[-1].quantize(method=method)
frames = [frame.quantize(method=method, palette=palettized) for frame in frames]
# The animation will be played in a loop: start cycling with the most complete frame
first_frame = frames[-1]
next_frames = frames[:-1]
INTRO_DURATION = 3000
FRAME_DURATION = 1000
durations = [INTRO_DURATION] + [FRAME_DURATION] * len(next_frames)
params: dict[str, typing.Any] = dict(
save_all=True,
append_images=next_frames,
duration=durations,
loop=0,
)
match format:
case ImageFormat.GIF:
params.update(optimize=False)
case ImageFormat.WEBP:
params.update(lossless=True)
image_io = BytesIO()
first_frame.save(image_io, format, **params)
return image_io
def display_generation_graph(
graph: nx.DiGraph,
format: ImageFormat | None = None,
animated: bool = False,
save_image: bool = False,
) -> None:
if format is None:
format = ImageFormat.WEBP if running_in_colab_env else ImageFormat.PNG
if animated:
image_io = draw_generation_graph_animation(graph, format)
else:
image_io = draw_generation_graph(graph, format)
image_bytes = image_io.getvalue()
IPython.display.display(IPython.display.Image(image_bytes))
if save_image:
stem = “graph_animated” if animated else “graph”
Path(f”./{stem}.{format.value}”).write_bytes(image_bytes)
Source Credit: https://medium.com/google-cloud/generating-consistent-imagery-with-gemini-nano-banana-6e807b4d1f77?source=rss—-e52cf94d98af—4


