Have you ever wondered how platforms like Yahoo Finance or Google Stocks deliver market data so fast? I did too. And as a data analyst fascinated by cloud engineering, I wanted to recreate a small version of that, something real-time, scalable, and insightful.
So I built a Real-Time Stock Market Data Pipeline using Google Cloud Platform (GCP). The goal? To pull in live stock prices, store them, clean them, and analyze the patterns, all using serverless tools from GCP.
Stock market data is:
- Fast-moving: Prices change by the second.
- Nested and messy: API responses are full of nested JSON.
- Demanding: We need performance, not just correctness.
This project shows how to handle such data in real-time using modern tools, no manual uploads, no local scripts, just a clean, automated pipeline in the cloud.
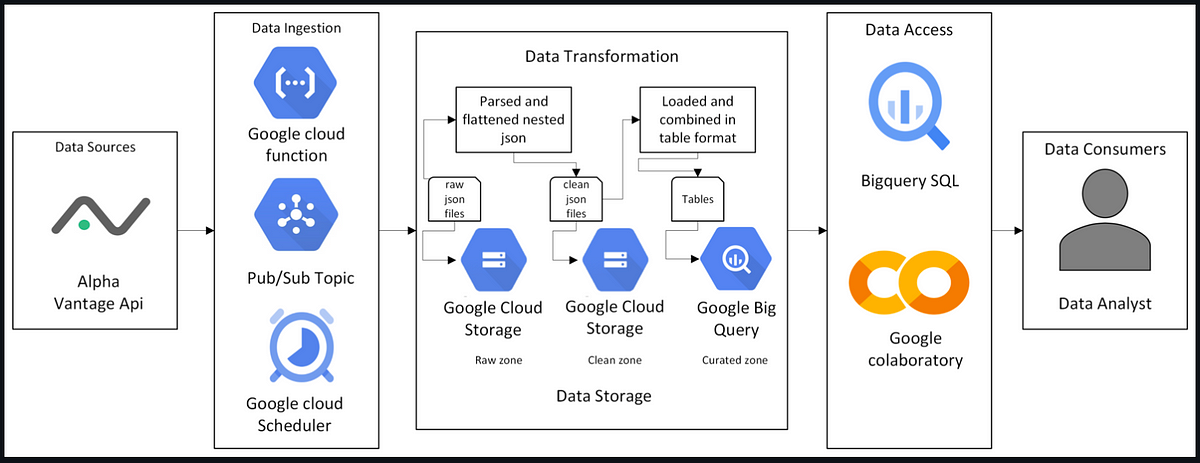
Here’s a quick view of how everything connects:
- Scheduler triggers API call every 5 minutes.
- Cloud Function fetches stock data → sends it to Pub/Sub.
- Another Function listens to Pub/Sub → saves raw data in Cloud Storage.
- A third Function flattens and cleans the JSON → loads it into BigQuery.
- BigQuery is where the magic happens: analysis, aggregation, and insights
Step 1: Fetch & Store Raw Data
- The Cloud Scheduler kicks things off.
- Cloud Function fetches data from Alpha Vantage.
- The raw JSON lands in Cloud Storage (Raw Zone).
from google.cloud import pubsub_v1API_KEY = "YOUR_API_KEY"
STOCKS = ['AAPL','MSFT','NVDA','AMZN','GOOGL']
PROJECT_ID = "YOUR_PROJECT_ID"
TOPIC_ID = "stock-data-topic"
publisher = pubsub_v1.PublisherClient()
topic_path = publisher.topic_path(PROJECT_ID, TOPIC_ID)
def get_stock_data(symbol):
url = f"https://www.alphavantage.co/query?function=TIME_SERIES_INTRADAY&symbol={symbol}&interval=5min&apikey={API_KEY}"
response = requests.get(url)
return response.json()
def publish_to_pubsub(data):
payload = json.dumps(data).encode("utf-8")
future = publisher.publish(topic_path, payload)
print(f"Published message ID: {future.result()}")
Step 2: Clean and Transform
- A second Cloud Function flattens the nested JSON.
- Cleaned data is stored in a new folder (Clean Zone).
BUCKET_NAME = "Your_bucket_name"
FLAT_FOLDER_SUFFIX = "_flat"def flatten_alpha_vantage_json(symbol, raw_json):
rows = []
time_series = raw_json.get("data", {}).get("Time Series (5min)", {})
for timestamp, values in time_series.items():
rows.append({
"symbol": symbol,
"timestamp": timestamp,
"open": values.get("1. open"),
"high": values.get("2. high"),
"low": values.get("3. low"),
"close": values.get("4. close"),
"volume": values.get("5. volume")
})
return rows
Step 3: Load to BigQuery
- Data is automatically pushed into curated tables.
- These tables are well-structured and ready for SQL.
bq_client = bigquery.Client()
table_id = f"{bq_client.project}.{BQ_DATASET}.{symbol.lower()}_flat"job_config = bigquery.LoadJobConfig(
source_format=bigquery.SourceFormat.NEWLINE_DELIMITED_JSON,
autodetect=True,
write_disposition="WRITE_APPEND",
)
uri = f"gs://{BUCKET_NAME}/{flat_blob_name}"
load_job = bq_client.load_table_from_uri(uri, table_id, job_config=job_config)
load_job.result()
print(f"Loaded into BigQuery: {table_id}")
Step 4: Analyze and Explore
Using BigQuery and Google Colab, I explored trends like:
- Avg close per day: Track how stocks behave daily
- Price volatility:
high - lowper timestamp - Avg volume: Understand trading activity
- Percent return: Simulate gains/losses
- Big price move with low volume: Detect unusual trading behavior
- Hourly pattern detection: Volatility by hour
- Open vs Close comparison: Market reaction during trading hours
Stock data is one of the most commonly used real-time datasets, and learning how to work with it in a scalable way gives you:
- Real-world cloud skills: Serverless functions, event-based architecture, storage zones
- Analytics muscle: How to ask and answer meaningful business questions using SQL
- Portfolio power: A polished project that shows employers you can think like an engineer and analyst
This was just Day 1 of what could be a bigger journey. I’d love to:
- Extend this over multiple days to track momentum
- Add data visualization using Looker Studio
- Integrate alerts for unusual market movements
Found this interesting? I’d love to hear your feedback or collaborate on something similar! Feel free to reach out on [LinkedIn] or check this project on GitHub.
Thanks for reading!
Source Credit: https://medium.com/google-cloud/building-a-real-time-stock-data-pipeline-with-google-cloud-bigquery-81ae2a52d511?source=rss—-e52cf94d98af—4


