
A complete lab guide to configuring split-routing, custom NetworkManager keyfiles, and Cisco IOS header sanitization for flawless UDM mapping.
I was recently tasked with ingesting Cisco Switch logs into Google Security Operations, and after configuring my lab environment to test out the ingestion pipeline I came across some roadblocks that made things a bit more difficult than the official documentation describes.
It is important to consider that even though new hardware and software releases are being rolled out constantly, many IT production infrastructures still use legacy equipment to manage their operations, and some require additional configurations beyond what one might initially consider.
This is the lab architecture setup:
To replicate a real-world scenario where split-routing and out-of-band management are necessary for a headless edge environment, I designed this hybrid laboratory architecture consisting of three main planes:
- The Management & Control Plane: An Arch Linux Workstation acts as the central command node. It manages the headless collector wirelessly via an active SSH session and interacts with the network hardware out-of-band using a physical USB-to-Console cable driven by the “tio” terminal I/O framework.
- The Isolated Data Segment: A dedicated point-to-point bridge over a standard RJ45 copper patch cable connects the Cisco Catalyst Switch (FastEthernet 0/1) to the Raspberry Pi 5 (eth0) on an isolated 192.168.10.0/24 subnet. Crucially, this wire interface is bound with zero upstream default gateways, ensuring that internal syslog telemetry traffic remains entirely localized and cannot bleed into the public internet.
- The Cloud Ingestion Pipeline: Utilizing split-routing at the kernel layer, the Raspberry Pi 5 uses its wireless interface (wlan0) to establish a secure WAN uplink to my home ONT. The locally installed BindPlane OTEL Agent forwards the incoming infrastructure data through the remote BindPlane Cloud proxy, landing the standardized logs directly into Google Security Operations.
Hardware and Software Requirements
To build and validate this deployment exactly as shown, the following physical components and software baselines were utilized in this laboratory build:
Host Workstation
- Arch Linux
- rpi-manager
- tio
Headless Edge Collector Node
- Raspberry Pi 5 (8GB RAM)
- 32GB Class-10 MicroSD Card
- AlmaLinux 9 for Raspberry Pi (GPT partition baseline)
- chronyd
- observiq-otel-collector
Target Network Infrastructure
- Cisco Catalyst 2960 Plus SI (24-Port FE, 8-Port PoE model)
- Cisco IOS version 15.2(7)E6
This article’s end goal is to serve as a step-by-step documentation on how to build up the entire lab environment infrastructure from scratch: From flashing the AlmaLinux 9 image to a MicroSD card to troubleshooting incorrectly formatted Cisco syslogs for Google SecOps parser normalization into the UDM format.
Flashing and Pre-Configuring the Headless Edge Node
Because a headless server operates completely without a local monitor or keyboard, we must perform what is known as a “headless pre-configuration”. This means we will edit the necessary network profiles and security parameters directly on the MicroSD card file system using our host laptop before booting the Raspberry Pi for the very first time.
Install Raspberry Pi Imager
Install the Raspberry Pi Imager flashing utility:
sudo pacman -Syu rpi-imager
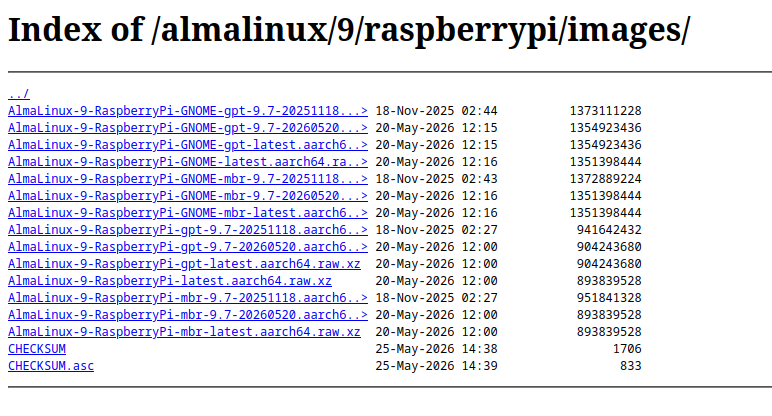
Next, download from here the official AlmaLinux 9 raw image built specifically for the Raspberry Pi architecture. Select the GPT Partition layout version labeled “-latest”.
Once both of them have been downloaded, launch the imager detached from the current terminal:
rpi-imager & disown && exit
In the graphical user interface, follow these selection parameters:
- Device: Raspberry Pi 5
- OS: Scroll to the bottom, choose “Use Custom”, and select the downloaded AlmaLinux 9 compressed file.
- Storage: Choose the target MicroSD card.
- Start the flashing process and wait for the validation verification process to complete.
Mount the Root File System Locally
Once flashed, do not insert the card into the Pi yet. Remove it and plug it back into the host workstation and run the following command to identify the block names assigned to its partitions by the kernel:
lsblk
The system output will display the drive block structure:
NAME        MAJ:MIN RM   SIZE RO TYPE MOUNTPOINTS
sda           8:0    1  29.7G  0 disk
├─sda1        8:1    1   477M  0 part
└─sda2        8:2    1   2.2G  0 part
In this environment, /dev/sda1 represents the small boot segment, and /dev/sda2 houses the main Linux system file structure.
Create a local mounting point and bind the system partition to it:
mkdir -p ~/mnt/almalinux_root
sudo mount /dev/sda2 ~/mnt/almalinux_root
Inject the Wi-Fi Profile Directly Into Storage
AlmaLinux 9 relies on standard NetworkManager keyfiles (.nmconnection) to declare system networking parameters. We will natively create the deployment environment’s home wireless profile inside the mounted card directory:
sudo nano ~/mnt/almalinux_root/etc/NetworkManager/system-connections/home-wifi.nmconnection
Paste the following system connection block into the keyfile (make sure to replace the “SSID_HERE” and “PASSWORD_HERE” with real values):
[connection]
id=home-wifi
uuid=a1b2c3d4-e5f6-7a8b-9c0d-1e2f3a4b5c6d
type=wifi
interface-name=wlan0

[wifi]
mode=infrastructure
ssid=SSID_HERE

[wifi-security]
auth-alg=open
key-mgmt=wpa-psk
psk=PASSWORD_HERE

[ipv4]
method=auto

[ipv6]
method=ignore
It is important to notice that NetworkManager strictly mandates that any custom profile keyfile containing plain-text security keys belong exclusively to the root user with an explicit permission masking. Run the following to secure it:
sudo chmod 600 ~/mnt/almalinux_root/etc/NetworkManager/system-connections/home-wifi.nmconnection
Manually Authorize the Host Workstation’s SSH Public Key
By default, this server image completely restricts password-based interactive access over remote SSH endpoints. The host workstation’s public cryptographic token must be manually appended to the target user profiles before initialization.
Verify if any SSH keypair already exists on the host workstation, or generate an Ed25519 pair:
ls -l ~/.ssh/id_*.pub || ssh-keygen -t ed25519 -C "laptop-to-pi"
Create the hidden operational configuration folder environment on the mounted partition path:
sudo mkdir -p ~/mnt/almalinux_root/home/almalinux/.ssh
Append the host workstation’s public cryptographic key file to the user authorization ledger index:
cat ~/.ssh/id_*.pub | sudo tee -a ~/mnt/almalinux_root/home/almalinux/.ssh/authorized_keys
Enforce strict OpenSSH directory structures and ownership parameters to prevent access denial checks during negotiation:
sudo chown -R 1000:1000 ~/mnt/almalinux_root/home/almalinux/.ssh
sudo chmod 700 ~/mnt/almalinux_root/home/almalinux/.ssh
sudo chmod 600 ~/mnt/almalinux_root/home/almalinux/.ssh/authorized_keys
Unmount and Complete the First Headless Boot
Unmount the device mapping from the local terminal session:
sudo umount ~/mnt/almalinux_root
Slide the card into the Raspberry slot and connect the power supply. Wait 2 to 3 minutes. On its first initialization, the kernel will expand the storage partition to occupy the remaining sector of the card and automatically reboot itself once completed. This phase ends when the green LED drops to a steady state.
Log into your home ONT deployment client table interface to discover the assigned dynamic IP address.
Once verified, you can now connect to the Raspberry using SSH:
ssh almalinux@IP_ADDRESS
Configure Isolated Ethernet Interface for Local Cisco Syslog
To properly isolate the internal networks, a static IP schema must be hard-bound to the physical link (eth0) without specifying a gateway routing address, ensuring outbound cloud telemetry routes out exclusively across the active wireless interface (wlan0).
Verify the network naming flags assigned by the system kernel (interface eth0 is assumed from now on):
ip link show
Create a fresh connection profile named “cisco-eth” bound directly to the hardware socket:
sudo nmcli connection add type ethernet con-name cisco-eth ifname eth0 ipv4.method manual ipv4.addresses 192.168.10.2/24
Instruct NetworkManager never to associate a default gateway metric routing entry with this interface, stopping local lookup paths from mapping outward over this wire:
sudo nmcli connection modify cisco-eth ipv4.never-default yes
sudo nmcli connection up cisco-eth
Verify the internal kernel routing tables to ensure the default gateway rules remain uniquely bound to the wireless device network:
ip route show
Expected output layout:
default via 192.168.68.1 dev wlan0 proto dhcp src 192.168.68.113 metric 600
192.168.10.0/24 dev eth0 proto kernel scope link src 192.168.10.2 metric 100
Local Enterprise Firewall & Time Tuning
Open the necessary transport filters to accept remote logging metrics packages over UDP port 5140 and authoritative local clock polls:
sudo firewall-cmd --zone=public --add-port=5140/udp --permanent
sudo firewall-cmd --zone=public --add-service=ntp --permanent
sudo firewall-cmd --reload
Set the timezone matching the user’s infrastructure workspace configuration framework:
sudo timedatectl set-timezone TIMEZONE
Configure the local Chrony NTP daemon config file:
sudo nano /etc/chrony.conf
Append the following tracking lines to the bottom of the config file to turn the Pi 5 into an authoritative Stratum 10 Master Time Server capable of distributing clean tracking metrics even when disconnected from public network sources:
# Allow devices in the isolated switch network to request time syncs
allow 192.168.10.0/24

# Pretend you are a high quality stratum 10 master clock if internet drops
local stratum 10
Apply and write variables to persistent system state:
sudo systemctl enable --now chronyd
sudo systemctl restart chronyd
sudo timedatectl set-ntp true
sudo hwclock --systohc
BindPlane Configuration and Agent Installation
Out-of-Band Hardware Connection and Cisco Switch Configuration
Now that our headless edge node is prepared, we must shift our focus to the physical infrastructure plane. Legacy equipment, such as the Cisco Catalyst 2960 Plus series, requires meticulous sanitation at the console level to ensure its telemetry aligns perfectly with what is expected by the CISCO_SWITCH Google SecOps default parser.
Install and Initialize tio Serial Utility
“tio” features predictable configuration states and a robust auto-reconnect engine that seamlessly restores a CLI session if a console cable is accidentally unplugged.
Install “tio” via the Arch User Repository (AUR) helper:
yay -S tio
To identify the exact system virtual file created by the USB-to-Console cable, stream the kernel ring buffer logs in real-time:
sudo dmesg -w
Plug the USB-to-Console cable into the host workstation. Look for lines indicating a new terminal device initialization:
[ 6073.458213] usb 3-2: New USB device found, idVendor 1a86, idProduct=7523
[ 6073.458237] usb 3-2: Product: USB2.0-Ser!
Exit dmesg and verify the file structure in the local directory (usually the file is /dev/ttyUSB0):
ls /dev/ttyUSB*
Launch “tio” at the standard Cisco console execution baseline of 9600 baud, adding the session logging flag to maintain a clean text audit trail of all commands and switch outputs:
sudo tio --baud 9600 --log-file cisco-switch.log /dev/ttyUSB0
This lab assumes a factory-default configuration, therefore when prompted with the initial setup dialog, type “no” to bypass the wizard and access the raw execution environment CLI.
Interface Hardening and SVI Provisioning
Elevate your privileges to global configuration mode, assign a structured hostname, and secure the physical link port leading to the Raspberry Pi edge node:
Switch> enable
Switch# configure terminal
Switch(config)# hostname NewPatrickSwitch
We will explicitly lock down FastEthernet 0/1 as a standard access port bound tightly to management VLAN 1:
NewPatrickSwitch(config)# interface fastEthernet 0/1
NewPatrickSwitch(config-if)# description Link_to_Raspberry_Pi_5
NewPatrickSwitch(config-if)# switchport mode access
NewPatrickSwitch(config-if)# switchport access vlan 1
NewPatrickSwitch(config-if)# no shutdown
NewPatrickSwitch(config-if)# exit
Assign the management static IP structure to the internal SVI for VLAN 1 to enable local IP Layer-3 communications with our isolated segment:
NewPatrickSwitch(config)# interface vlan 1
NewPatrickSwitch(config-if)# description Management_Interface
NewPatrickSwitch(config-if)# ip address 192.168.10.1 255.255.255.0
NewPatrickSwitch(config-if)# no shutdown
NewPatrickSwitch(config-if)# end
Validate layer-3 network connectivity by throwing a local ICMP echo package directly at the Raspberry Pi’s static wired address:
NewPatrickSwitch# ping 192.168.10.2
Assuming initial ARP requests and replies have already been sent, there should be a success rate of 100%:
Sending 5, 100-byte ICMP Echos to 192.168.10.2, timeout is 2 seconds:
!!!!!
Success rate is 100 percent (5/5), round-trip min/avg/max = 1/203/1007 ms
Apply Google Security Operations Compliant Syslog Tweaks
Unconfigured Cisco switches append dynamic transaction counters and use local system uptime markers by default. These changes shift the log layout space, which skews the default parser pattern checks.
Execute the following specific optimization directives to sanitize the header format.
- Header Sanitization and Sequence Stripping: This completely strips extraneous dynamic numeric prefixes from the wire format. The log message begins exactly where the parser expects it to.
NewPatrickSwitch(config)# no service sequence-numbers
NewPatrickSwitch(config)# no logging message-counter syslog
- Standardized Calendar Datetime Stamps: This tells the switch to stop using raw system uptime counters and switch to standard calendar datetime strings, which is a mandatory parameter for time-series log entries.
NewPatrickSwitch(config)# service timestamps log datetime
- Native Asset Identity Injection: Standard syslog packets do not naturally broadcast their host identity within the data payload header. This command forces the switch to cleanly inject its assigned hostname directly into the message prefix, allowing the cloud environment to dynamically identify the source asset (principal.asset.hostname/ principal.hostname)
NewPatrickSwitch(config)# logging origin-id hostname
- Routing/Ingestion Delivery Parameters and NTP client Configuration: Point the log delivery subsystem tracking lines to route directly over UDP toward the local collection server port. Also, we configure the switch to sync its clock with our NTP server:
NewPatrickSwitch(config)# ntp server 192.168.10.2 prefer
NewPatrickSwitch(config)# logging host 192.168.10.2 transport udp port 5140
Force the switch to bind all logging traffic source tracking exclusively to the local SVI interface to maintain network validation, and open ingestion trap parameters to collect informational messages:
NewPatrickSwitch(config)# logging source-interface vlan 1
NewPatrickSwitch(config)# logging trap Informational
NewPatrickSwitch(config)# logging console Informational
NewPatrickSwitch(config)# end
Commit the entire operational configuration to NVRAM so it survives any hardware reboots or lab power cycles:
NewPatrickSwitch# copy running-config startup-config
Verify Live Log Generation on the Pi 5 terminal
To make sure our pipeline is fully operational, open the remote SSH session to the Raspberry Pi and spin up a raw packet capture session focused on UDP port 5140:
sudo tcpdump -i eth0 udp port 5140 -nn -X
While tcpdump is running, return to CLI session on the Cisco switch and execute an administrative link state shift to trigger a log event:
NewPatrickSwitch# configure terminal
NewPatrickSwitch(config)# interface fastEthernet 0/2
NewPatrickSwitch(config-if)# shutdown
NewPatrickSwitch(config-if)# no shutdown
The tcpdump terminal trace on the Pi 5 will instantly catch the wire-formatted packets:
18:44:16.867648 IP 192.168.10.1.54007 > 192.168.10.2.5140: UDP, length 124
 0x0000:  4500 0098 0007 0000 ff11 25fa c0a8 0a01  E.........%.....
 0x0010:  c0a8 0a02 d2f7 1414 0084 0982 3c31 3831  ............<181
 0x0020:  3e3a 204e 6577 5061 7472 6963 6b53 7769  >:.NewPatrickSwi
 0x0030:  7463 683a 204a 756e 2032 3820 3030 3a34  tch:.Jun.28.00:4
 0x0040:  343a 3135 3a20 254c 494e 4b2d 352d 4348  4:15:.%LINK-5-CH
 0x0050:  414e 4745 443a 2049 6e74 6572 6661 6365  ANGED:.Interface
 0x0060:  2046 6173 7445 7468 6572 6e65 7430 2f32  .FastEthernet0/2
 0x0070:  2c20 6368 616e 6765 6420 7374 6174 6520  ,.changed.state.
 0x0080:  746f 2061 646d 696e 6973 7472 6174 6976  to.administrativ
 0x0090:  656c 7920 646f 776e                      ely.down
BindPlane Collector Pipeline and Google Security Operations Validation
With telemetry cleanly formatted on the local network, the next steps focus on plumbing the collection engine inside the Raspberry Pi and verifying its schema normalization into Google SecOps SIEM.
Install and Connect the BindPlane Agent
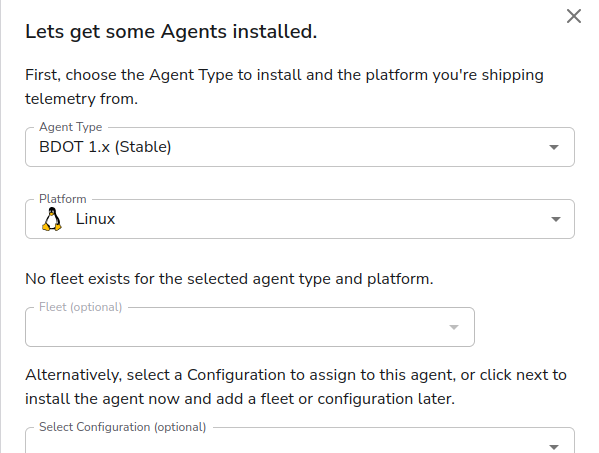
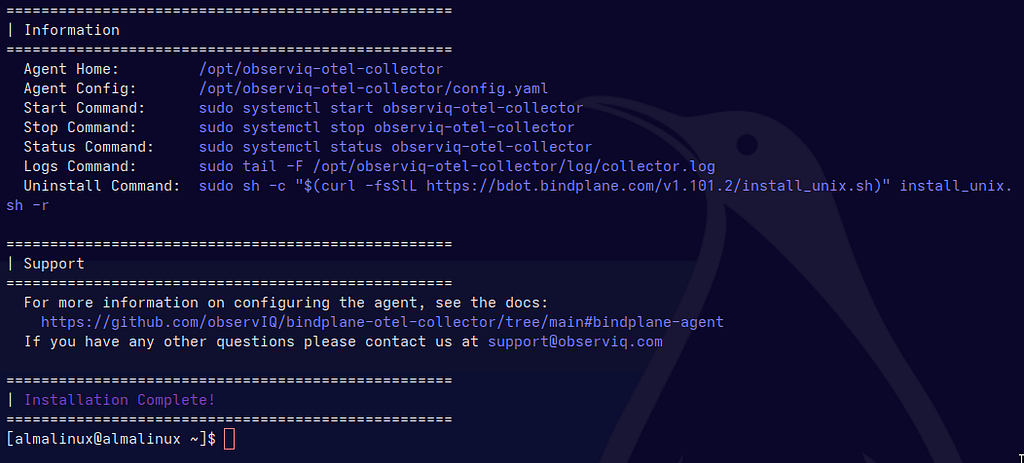
Log in to your remote BindPlane server management interface and initiate a new agent addition workflow. The platform will generate a dedicated installation command wrapper. Copy this one-liner and paste it directly into the active AlmaLinux 9 SSH terminal session to deploy the collector:
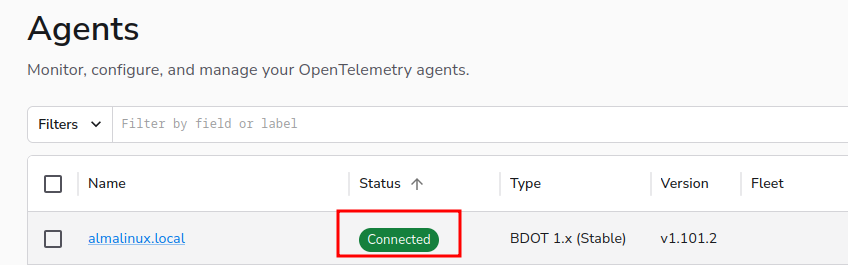
Once the installation routine completes, return to the BindPlane web UI to verify that the edge node has successfully checked in and shows an active connection state:
Establish the Cloud Ingestion Pipeline
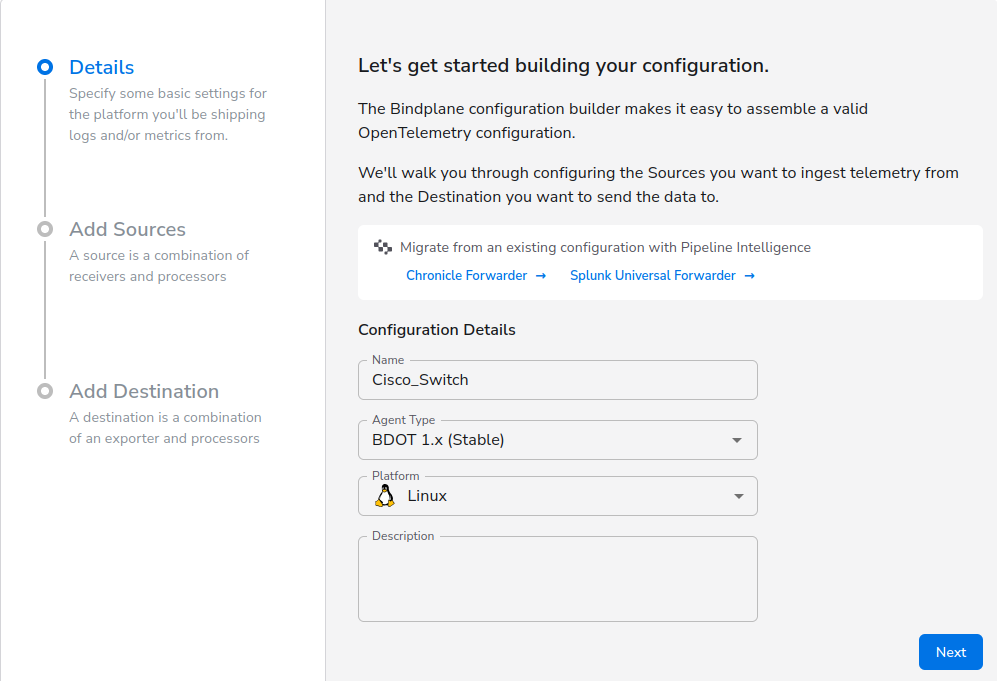
With the agent communicating with the control plane, we must create a dedicated agent configuration blueprint. This design maps how the collector captures local wire data, processes it, and ships it upstream.
Inside BindPlane, construct a configuration topology using the following parameters across three foundational layers:
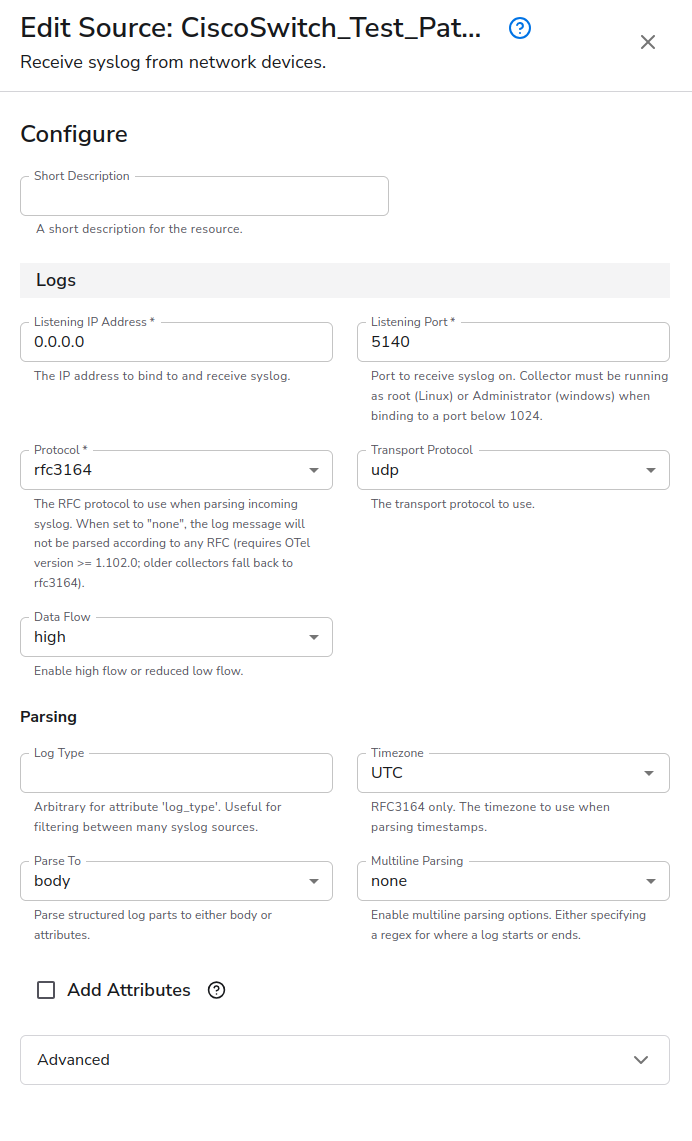
Source
- Resource Type: Syslog
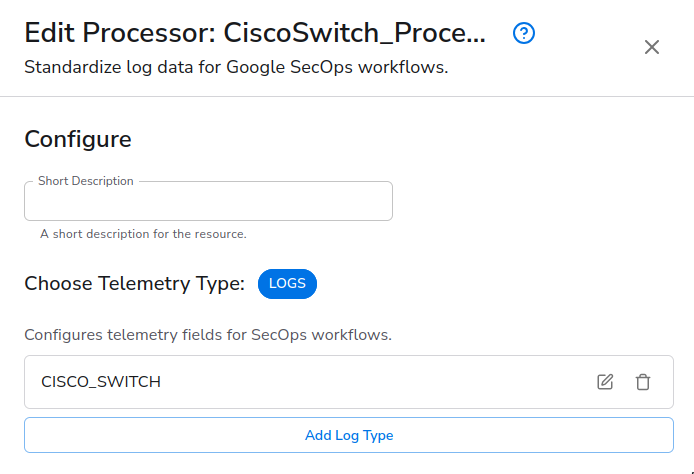
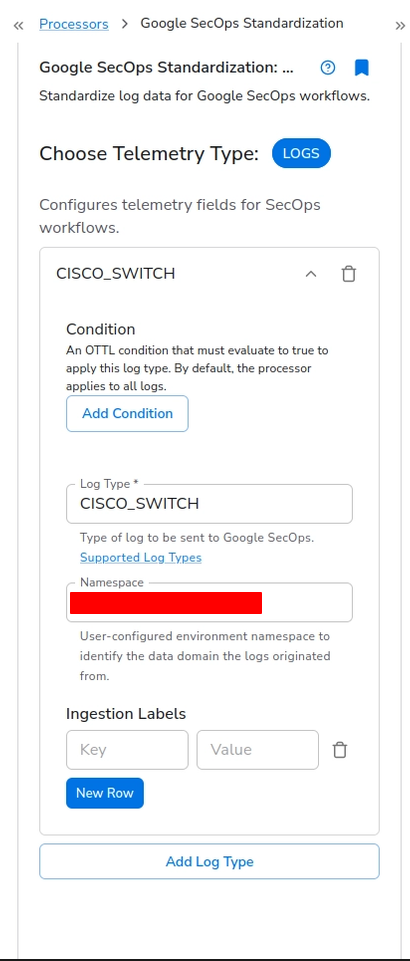
Processor
- Resource Type: Google SecOps Standardization
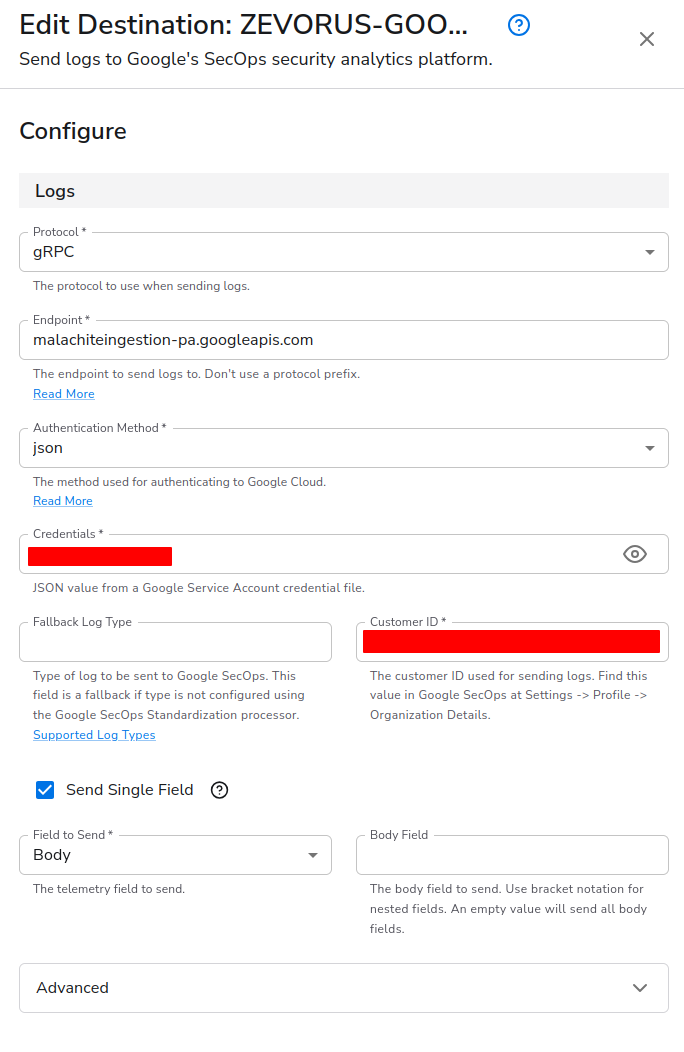
Destination
- Resource Type: Google SecOps
Once the source, processor and destination have been configured, we can now create the agent configuration:
Once the previously created source and destination are added to the configuration, the ingestion pipeline should look like this:
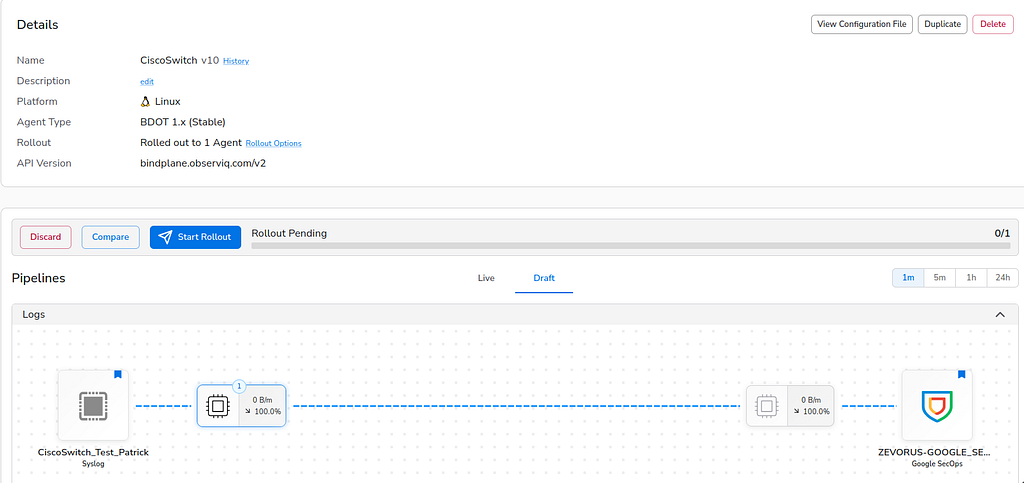
Insert the Processor and Rollout Configuration
With the configuration created, add the CISCO_SWITCH processor and assign a specific namespace to identify the test logs in the Google SecOps platform:
With the pipeline logic fully prepared, we add the active agent to this configuration and trigger the rollout.
Verify Local Service Status and Active Socket Bindings
To confirm that the new configuration policy has successfully pushed down from the cloud server and parsed into the edge node’s volatile memory, return to the AlmaLinux 9 terminal. Run the following system diagnostics to audit service health and verify that the collector is dynamically listening on network port 5140:
sudo systemctl status observiq-otel-collector
sudo ss -ulnp | grep 5140
The active system state checks should return the following:
#OUTPUT 1 (systemctl)
observiq-otel-collector.service - observIQs distribution of the OpenTelemetry collector
     Loaded: loaded (/usr/lib/systemd/system/observiq-otel-collector.service; enabled; preset: disabled)
     Active: active (running) since Mon 2026-05-04 18:00:06 CST; 1 month 23 days ago
   Main PID: 658 (observiq-otel-c)
      Tasks: 10 (limit: 50153)
        CPU: 7.231s
     CGroup: /system.slice/observiq-otel-collector.service
             └─658 /opt/observiq-otel-collector/observiq-otel-collector --config config.yaml

#OUTPUT 2 (ss)
UNCONN 0      0                  *:5140            *:*    users:(("observiq-otel-c",pid=658,fd=8))
UDM Validation and Event Viewing in Google SecOps
The final mile of this implementation is verifying that the telemetry safely lands in the Google SecOps SIEM platform and normalizes correctly into UDM.
Query Events in Google SecOps SIEM Search to Verify Ingestion and UDM Field Mapping
To validate that the end-to-end ingestion pipeline is working perfectly, open a Google Security Operations window to track incoming telemetry streams in real-time.
When an interface state change occurs on the wire, the default CISCO_SWITCH parser natively intercepts the data bytes, decodes the incoming RFC 3164 string format, and maps it directly into structured UDM fields.
An adequate, properly sanitized raw syslog payload landing into the collector edge interface will look like this:
<181>: NewPatrickSwitch: Jun 23 20:38:17: %LINEPROTO-5-UPDOWN: Line protocol on Interface FastEthernet0/2, changed state to up
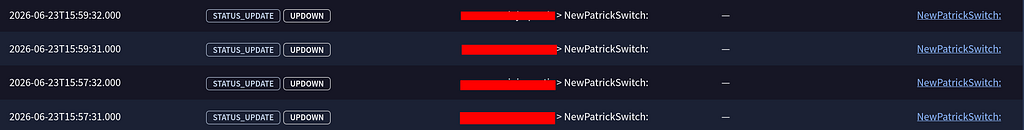
To filter out generic clutter and quickly verify your inbound stream inside SIEM Search, execute the following UDM query:
metadata.logtype = "CISCO_SWITCH"
The interface will return a list of successfully ingested logs matching our switch’s hostname and status updates:
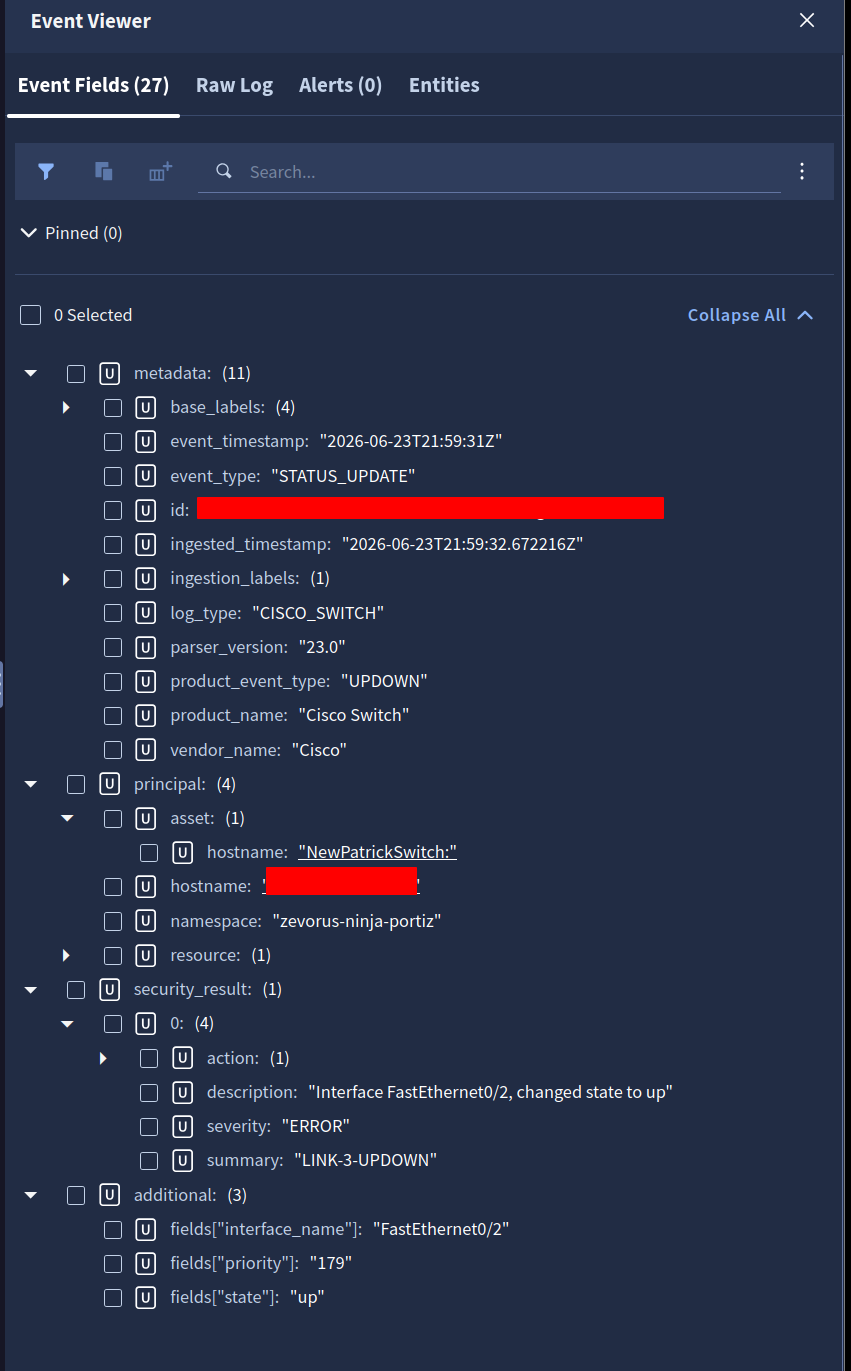
Expanding any of these rows reveals the finalized, normalized UDM parsed log structure, completely schema-mapped:
Appendix: Cisco Syslog Reference Ledger (What NOT to Do… trust me)
To save you some serious debugging time, here is a ledger of inadequate and incorrectly formatted raw logs collected during my lab testing. If your logs look like any of these examples on the wire, the default cloud parser will fail, and your events will either parse incorrectly, not parse at all, or experience severe processing delays:
<190>32: *Mar 1 02:21:53.421: %SYS-6-LOGGINGHOST_STARTSTOP: Logging to host 192.168.10.2 port 5140 started - CLI initiated
<181>35: *Mar 1 02:25:00.085 UTC: %SYS-5-CONFIG_I: Configured from console by console
<181>: Switch: Jun 20 17:00:39.398 UTC: %SYS-5-CONFIG_I: Configured from console by console
<181>: 000082: Jun 20 17:05:36.347 UTC: %SYS-5-CONFIG_I: Configured from console by console
<181>: Switch: Jun 21 14:29:25.124 UTC: %LINK-5-CHANGED: Interface FastEthernet0/2, changed state to administratively down
<189>: PatrickSwitch: Jun 21 2026 16:48:41 UTC: %SYS-5-CONFIG_I: Configured from console by console
Final Thoughts & Lessons Learned
I won’t lie, I had a lot of headaches trying to follow the official documentation only to end up with mangled log strings and zero event outputs in my SIEM. There were plenty of times during this build where I thought I finally had everything dialed in, only to hit another roadblock and realize I was right back at square one.
Now, many of you might be thinking, “Why go through all this trouble? Why not just write a custom parser extension in SecOps and be done with it?” And my answer to that is simple: learning.
Sure, a parser extension might patch the symptom, but pushing through the actual infrastructure dead ends is where the real learning happens. By forcing the hardware to output clean, standard telemetry, I learned tons about the nuances of Linux kernel routing tables, the strictness of NetworkManager permissions, and exactly why SecOps parsers expect what they expect.
Building an isolated ingestion pipeline isn’t always plug-and-play, especially when bridging legacy infrastructure with modern cloud architecture. But once you get those headers sanitized at the source and watch the raw data seamlessly normalize into clean UDM fields without any duct-tape code, the effort is entirely worth it.
If you are currently hitting a wall with your own pipeline deployment, don’t sweat it. Double-check your timestamps, audit your interface metrics, and keep iterating.
Happy logging!
How to Ingest Cisco Switch Syslogs into Google SecOps Using a Headless Raspberry Pi 5 was originally published in Google Cloud – Community on Medium, where people are continuing the conversation by highlighting and responding to this story.
Source Credit: https://medium.com/google-cloud/how-to-ingest-cisco-switch-syslogs-into-google-secops-using-a-headless-raspberry-pi-5-e369f7867e66?source=rss—-e52cf94d98af—4


