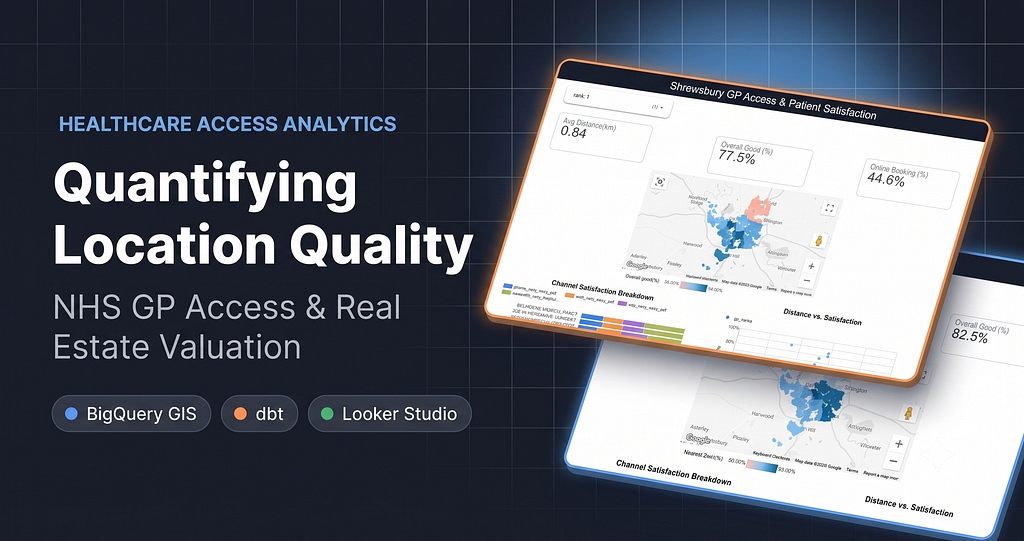
Quantifying Location Quality for Real Estate Valuation: Modeling NHS Healthcare Access in Shrewsbury with BigQuery GIS, dbt, and Looker Studio
Introduction: Healthcare Access as a Key Factor for Real Estate Value
When we estimate property value, location and quality of life are just as important as the building itself. Among many location factors, good access to healthcare — such as living near a GP surgery, getting appointments easily, and short wait times — makes a neighborhood much more attractive.
As part of an ongoing project to build a local property valuation system for Shrewsbury, UK, this article shows how to process public NHS healthcare data into a simple Healthcare Accessibility Score.
To make this data pipeline clean, reliable, and production-ready, we built a modern workflow using BigQuery GIS, dbt Cloud, and Looker Studio.
Tech Stack Evolution: Combining BigQuery and dbt
In previous articles, data transformations were written using raw BigQuery SQL scripts. While this works well for small tests, a growing real estate analytics engine needs clean organization, automated testing, and clear data tracking.
BigQuery serves as our highly scalable database engine. It calculates spatial distances between thousands of postcodes and GP surgeries very fast.
To complement BigQuery’s processing power with software engineering best practices, we integrated dbt Cloud. Using BigQuery for fast calculations together with dbt for code testing and workflow management gives us a clean 3-layer Medallion Architecture:
- Raw Data Layer (BigQuery): Raw NHS public data (GP staff counts, patient surveys, wait times, and UK postcodes).
- Staging Layer (staging): Cleaning data, fixing column names, and making data types consistent.
- Marts Layer (marts): Main business logic, spatial distance calculations (ST_DISTANCE), and key metrics (like patient-to-doctor ratios).
- BI & Feature Store Layer (Looker Studio): Interactive dashboards for users and location features for property valuation models.
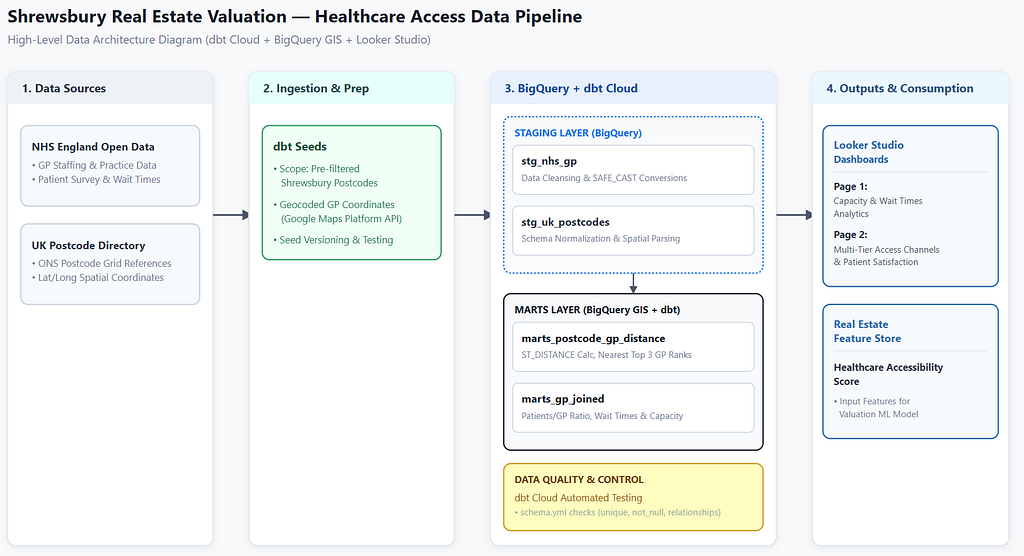
Data Pipeline Flow:
- Data Ingestion (dbt Seeds): Raw NHS healthcare data and UK postcode records are pre-filtered for Shrewsbury. GP coordinates are geocoded using Google Maps and loaded as dbt seeds.
- Transformation & Testing (BigQuery + dbt Cloud): Data is cleaned in staging and transformed in marts using BigQuery GIS functions (ST_DISTANCE, ST_GEOGPOINT). dbt Cloud manages schema tests and data lineage.
- Output Layer (Looker Studio & Feature Store): The compiled marts tables feed Looker Studio dashboards and serve as location features for real estate valuation models.
Data Engineering & Spatial Modeling in dbt
1. Smart Data Scoping and Geocoding with dbt Seeds
Full NHS open datasets cover the entire UK and are too large to store directly inside a dbt repository (which would normally require loading via Google Cloud Storage). For this project, we pre-filtered the raw NHS data specifically for the Shrewsbury area before adding it as dbt seeds.
Additionally, since there are only a small number of GP surgeries in Shrewsbury, we manually collected their precise coordinates (latitude and longitude) using Google Maps. Defining these clean coordinates directly in a seed CSV made our spatial calculations simple, accurate, and fast.
2. Staging Cleanups (stg_*.sql)
Raw NHS data can have mixed formats and missing values. In the staging layer, we rename columns clearly and convert data types safely using SAFE_CAST so our pipeline stays stable.
3. Marts Layer for Distance & Capacity Analytics (marts_*.sql)
The main analytics work happens in the marts layer:
- Distance Matrix (marts_postcode_gp_distance.sql): Uses BigQuery GIS functions (ST_DISTANCE, ST_GEOGPOINT) to quickly find the top 3 nearest GP surgeries (Rank 1, Rank 2, and Rank 3) for every Shrewsbury postcode.
- Clinic Capacity (marts_gp_joined.sql): Combines staff numbers and appointment data to calculate key metrics, such as Patients per GP (patients_per_gp_fte) and 2-Week Wait Rate (wait_over_2weeks_pct).
Data Quality and Automated Testing with dbt
One major benefit of adopting dbt is automated data testing. In schema.yml, we set rules to check our data automatically:
- Check that ID columns (like gp_code) are unique and not empty (not_null).
- Run automated tests with dbt build before updating the main database branch.
This keeps our data clean and reliable before it goes into downstream real estate valuation models.
Visualizing Location Quality in Looker Studio
Connecting our compiled marts tables to Looker Studio turns spatial and healthcare analytics into clear, visual stories. The interactive dashboard consists of two core pages:
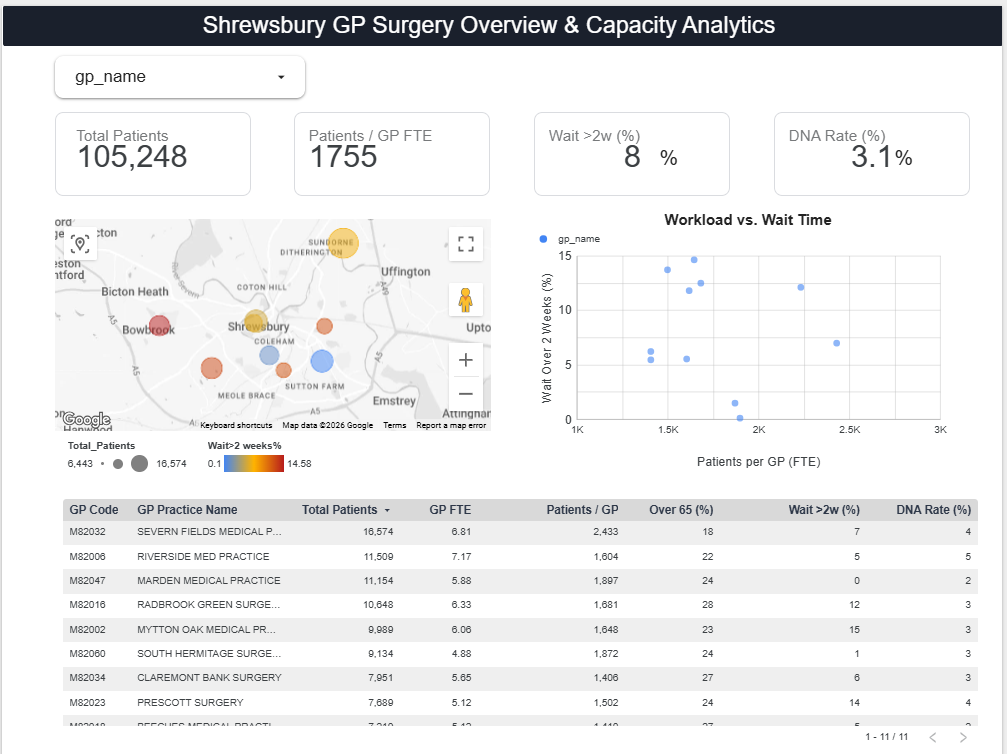
1. Page 1: Surgery Capacity & Wait Times
The first page focuses on operational workload and service speed across Shrewsbury:
- KPI Scorecards: Top metrics highlight total patient population (105,248), doctor workloads (1,755 patients per GP FTE), and long wait rates (8.2% waiting over 2 weeks).
- Bubble Map & Scatter Plot: Shows surgery scale (bubble size) and 2-week wait rates (color gradient from blue to orange) alongside a workload-to-wait scatter plot to pinpoint local operational bottlenecks.
2. Page 2: Multi-Tier Access Channels & Patient Satisfaction
The second page introduces an interactive rank filter (Rank 1, Rank 2, Rank 3) to evaluate both primary care and backup options:
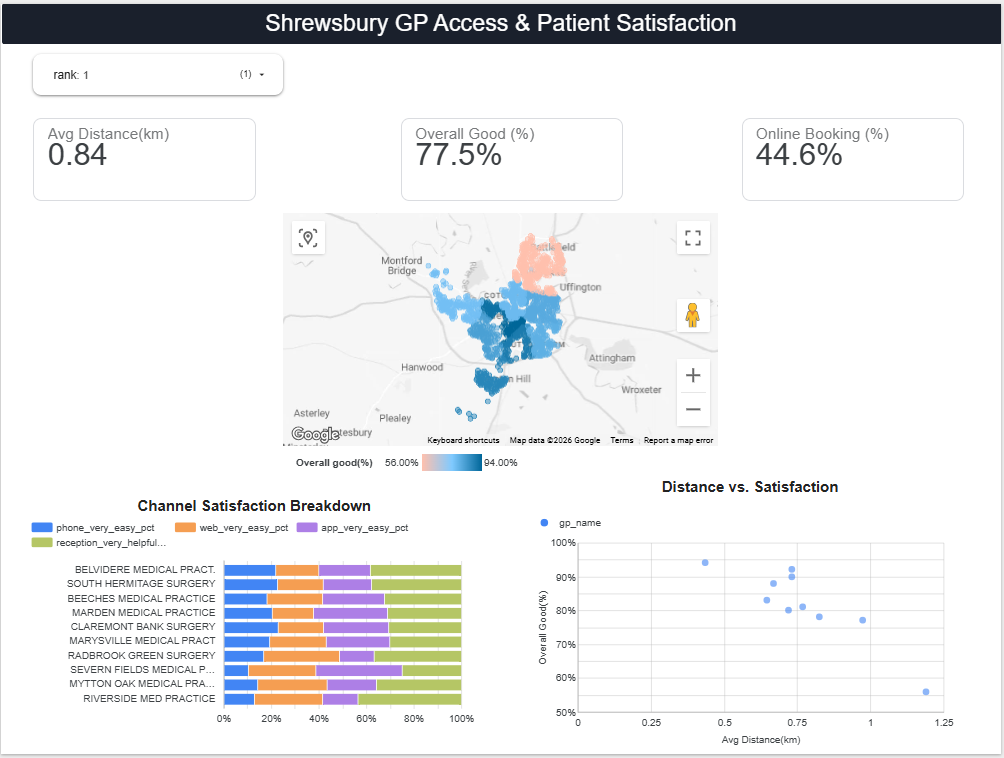
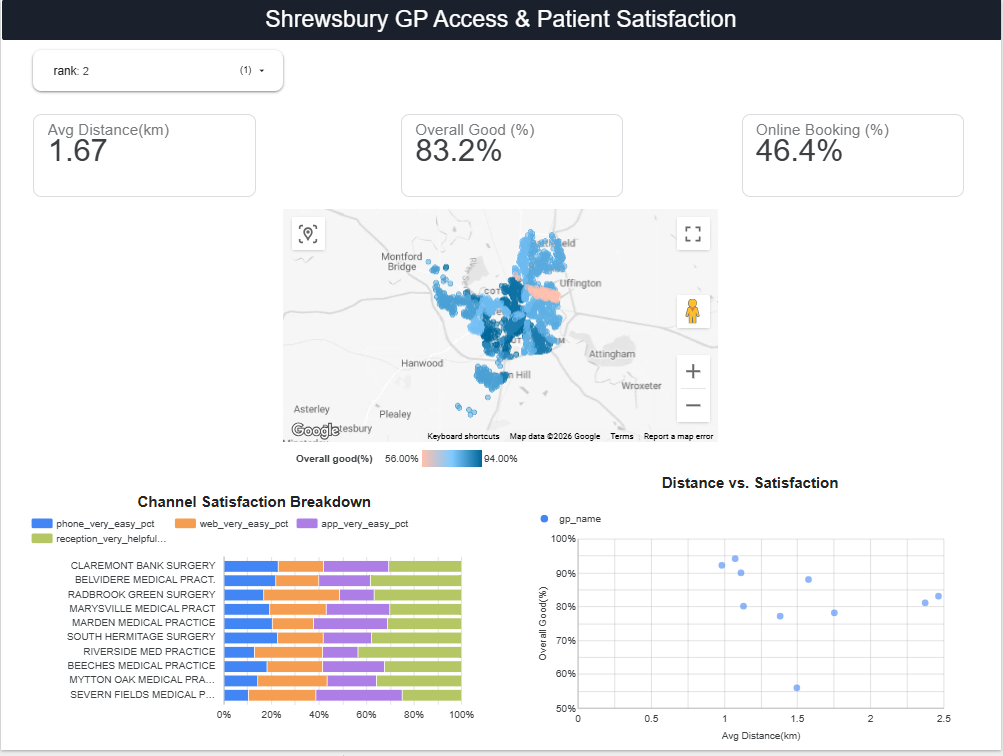
- Interactive Postcode Map: Plots Shrewsbury postcodes color-coded by patient satisfaction (Overall Good (%)), dynamically updating as users filter between 1st, 2nd, and 3rd nearest GP surgeries.
- Channel Satisfaction Breakdown: A stacked bar chart comparing patient ratings across communication channels (phone, web, mobile app, and reception helpfulness).
- Distance vs. Satisfaction: A scatter plot illustrating how travel distance (Avg Distance (km)) correlates with patient ratings for the selected distance rank.
Multi-Tier Quality Analysis: Evaluating Backup Options
A key feature of Page 2 is evaluating healthcare choices across distance ranks (1st, 2nd, and 3rd nearest GP). Instead of looking at only the single nearest clinic, users can interactively switch the rank filter to examine backup options.
Case Study: Healthcare Choices in North-East Shrewsbury
Comparing Figure 3 (Rank 1) and Figure 4 (Rank 2) resolves a tricky valuation case in North-East Shrewsbury:
- Rank 1 Result (Figure 3): For several postcodes in North-East Shrewsbury, the nearest GP (Rank 1) has lower patient satisfaction scores, indicated by the pinkish-orange clusters on the map (Overall Good (%): 77.5%, Avg Distance: 0.84 km). A naive nearest-neighbor model might prematurely penalize this sector as a “low healthcare quality” area.
- Rank 2 Backup Option (Figure 4): Switching the filter to Rank 2 dynamically updates the map, turning most of those pinkish postcode areas into light blue, while the regional average satisfaction rises to 83.2%. This visually proves that even if the immediate primary clinic has lower ratings, residents enjoy better secondary GP choices within a short travel radius (1.67 km).
By capturing these backup choices via dbt distance ranks, our property valuation model avoids unfairly penalizing desirable neighborhoods.
How This Fits into the Full Property Valuation Dashboard
The transformed data models (marts_postcode_gp_distance and marts_gp_joined) serve two key purposes:
- Interactive Dashboard: Empowers homebuyers and analysts to explore neighborhood data interactively in Looker Studio.
- Valuation Model Input: Provides a normalized Healthcare Accessibility Score for each postcode, which will be merged with flood risk data and energy performance ratings to predict real estate prices.
Summary & Next Steps
Combining BigQuery’s fast spatial capabilities with dbt’s simple engineering workflows turns raw public healthcare data into a clean, maintainable data product.
- 🔗 Code Repository: All dbt models, SQL queries, and schema test setups are available on GitHub: https://github.com/mhorikarin-hub/dbt-shrewsbury-gp-analysis
- 🔮 Next Steps: Expanding the Shrewsbury Property Valuation Dashboard by integrating broader liveability metrics, including educational environment and transport accessibility features.
Quantifying Location Quality for Real Estate Valuation: Modeling NHS Healthcare Access in… was originally published in Google Cloud – Community on Medium, where people are continuing the conversation by highlighting and responding to this story.
Source Credit: https://medium.com/google-cloud/quantifying-location-quality-for-real-estate-valuation-modeling-nhs-healthcare-access-in-2d7c7b8ea570?source=rss—-e52cf94d98af—4
About the Author


![ChatGPT vs Claude vs Gemini: 56 vs 46 Satisfaction [2026] – tech-insider.org](https://lh3.googleusercontent.com/J6_coFbogxhRI9iM864NL_liGXvsQp2AupsKei7z0cNNfDvGUmWUy20nuUhkREQyrpY4bEeIBuc=s0-w300-rw "ChatGPT vs Claude vs Gemini: 56 vs 46 Satisfaction [2026] – tech-insider.org")