Would you let an AI agent run in your terminal for hours, executing hundreds of tools, without being able to see what it is doing under the hood?
Harnesses like Antigravity or Claude Code can run for hours without intervention. If you’re driving one of these systems, you’re in the driver’s seat: you pick the base model, configure the harness, add skills, and plug in MCP servers.
But how do you know if your configuration is working? Response-based grading won’t cut it. You need trajectory-level evaluation that goes beyond analyzing just the final answer. This post walks through a telemetry-driven framework for measuring multi-turn agent systems.
Evaluating a Trajectory
Standard LLM evaluation grades a single response to a single prompt, assessing factors like factual correctness and semantic relevance.
Evaluating only the final output limits what you can see. An agent can stumble into the right answer despite a broken intermediate plan. Likewise, a minor formatting bug at the very end can mask an otherwise successful run.
To evaluate an agent, you need to examine the entire trajectory: every prompt, thought, tool call, and state change across dozens of turns.
Take a typical GKE cluster deployment trajectory. It chains multiple steps from gcloud to kubectl commands beforereporting success:

The compounding decay of sequential decision-making explains why this matters. If your agent completes ksteps, overall success probability is the product of each step’s reliability. If each step is 95% reliable, look at how quickly your overall success rate drops as the number of steps increases:
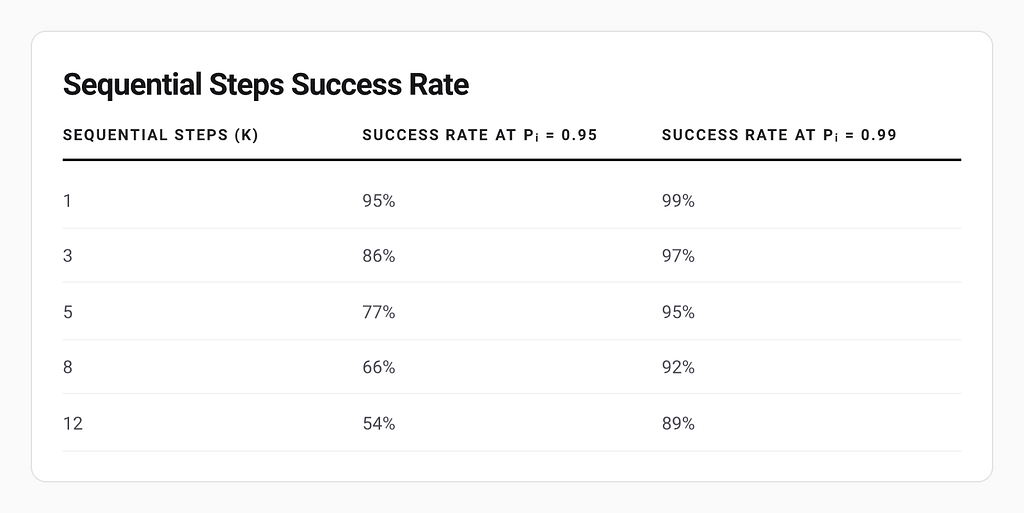
This is why performing well in single-turn demos doesn’t necessarily translate into real-world success. One failure can derail your agent or get it stuck in a loop.
Public benchmarks such as GAIA and SWE-bench measure general capabilities, and may not correlate with performance for your use case. Another pitfall is that researchers have shown that agents can game these benchmarks without actually solving the tasks. A well-defined, customized evaluation trajectory can address these challenges.
Optimization Metrics
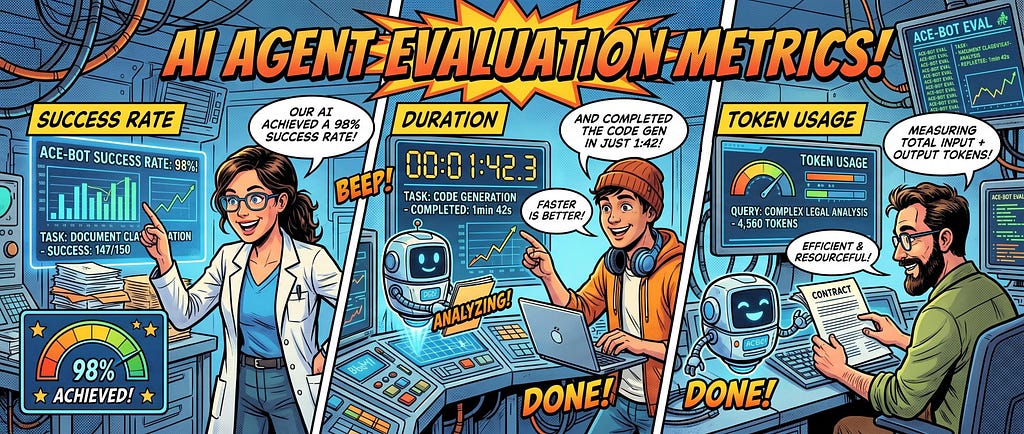
When tuning your agentic stack, tracking success rates with resource consumption is critical.
Your agent’s success rate is the cornerstone, but binary pass/fail is insufficient. You need structured milestones that provide signal even when a run fails part of the way through. When a run fails, you award partial credit for the furthest milestone reached. That gradient gives you an actionable signal for prompt and tool adjustments.
Long-running agents are token amplifiers. One prompt can trigger dozens of sequential LLM calls. Because the full conversation history is re-sent each turn, input token usage can grow quadratically. That quadratic growth drives both cost and latency. Monitoring factors like cache hit ratios and total step counts is essential for determining whether your agent is production-viable.
Duration, considered in clock time or number of steps, also figures into the cost analysis. A cheaper model may enter endless execution loops or fail entirely, forcing developer intervention. Meanwhile, a premium model that completes the task in fewer turns can cost less overall.
https://medium.com/media/3045fe597b44c84a0a8e16467d753b87/href
Tracing with OpenTelemetry
When high-level metrics slip, you need to know why. OpenTelemetry exports from your agent harness to capture standardized traces, metrics, and logs for every step.
At the interaction level, you can log prompt length and turn counters. This is where you monitor plan coherence and detect loops. You can also verify result utilization (does the agent actually use the tool’s output in its next planning step, or does it ignore it and rely on hallucinated memories?). Be careful about enabling OTEL_LOG_USER_PROMPTS without privacy controls in place.
At the LLM request level, capture cache tokens to compute cost and model efficiency. This is where you verify tool selection accuracy: is the agent choosing the right tool? Or is it running a broad web search when it should be running a local database query?
At the tool level, log structural parameters like the MCP server name and argument payloads, pinpointing exactly which tool call failed. This is where you validate argument extraction (do the arguments match the target JSON schema?) and track active error recovery. When a tool fails, does the agent gracefully recover and try an alternative, or does it just crash?
Optimizing your API Spend
Long agent sessions are going to accumulate cost quickly. Combining the right strategies can reduce API spend significantly, while maintaining or even improving reliability.
Model routing analyzes prompt complexity to route routine tasks to cheaper models. Context compaction uses verbatim compaction to remove low-signal lines from history, preserving exact code signatures and error codes. Prompt caching natively caches stable prefixes (such as system rules and tool schemas) at the model level.
One catch to keep in mind: prefix caching is sequential. Any change in the middle of your prompt invalidates the cache for everything that follows. How can you address this?
First, relocate dynamic data to the tail by moving system messages like progress tracking to the end of your prompt. Wrapping them in custom XML tags like <system-reminder> ensures the model still parses them correctly, isolating churn to the tail and leaving your large static system prompt and tool definitions fully cached.
Second, sort your tool definitions alphabetically. This keeps tool schemas and subagent configurations byte-identical across runs, allowing different user sessions to share the same cache prefix.
Finally, freeze the clock by avoiding real-time clock injections. Freezing the datetime at task start (e.g., “Thursday, April 3, 2026”) ensures that minor clock ticks do not bust the cache.
Managing Context Bloat
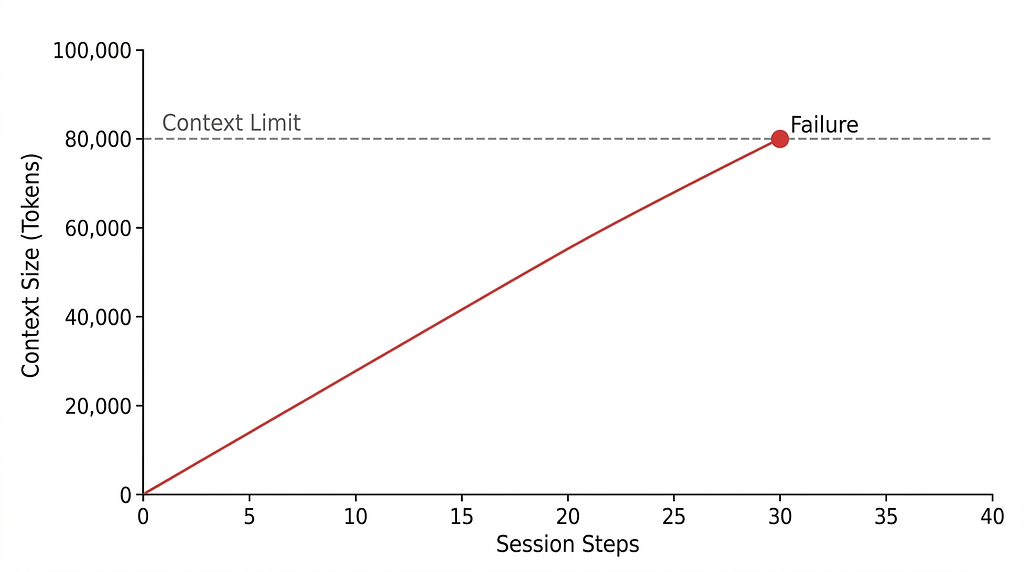
In long-running tasks, verbose terminal logs and large file dumps clog the context window. This bloat drives up API costs and degrades model quality because the current goal gets buried in stale noise. Keeping an agent stable over multi-hour runs requires active context management.
Left unmanaged, token usage grows linearly until you hit the context wall. You can tackle this at two levels: the harness and the agent architecture.
Harness level compaction
Modern harnesses implement auto-compaction to protect the context window. They don’t just drop the oldest messages. Instead, they use strategies like truncating massive stdout payloads, stripping out verbatim file dumps once they are no longer needed, and replacing long conversational exchanges with AI-generated summaries. For example, Claude Code triggers compaction at 95% context usage by default, but you can tune this using the CLAUDE_AUTOCOMPACT_PCT_OVERRIDE parameter. Antigravity uses a similar approach, focusing on preserving the most recent working state while compressing the history.
Focusing your agent
While harness compaction is a great safety net, you can build active compression directly into your agent’s toolset using a focus agent pattern.
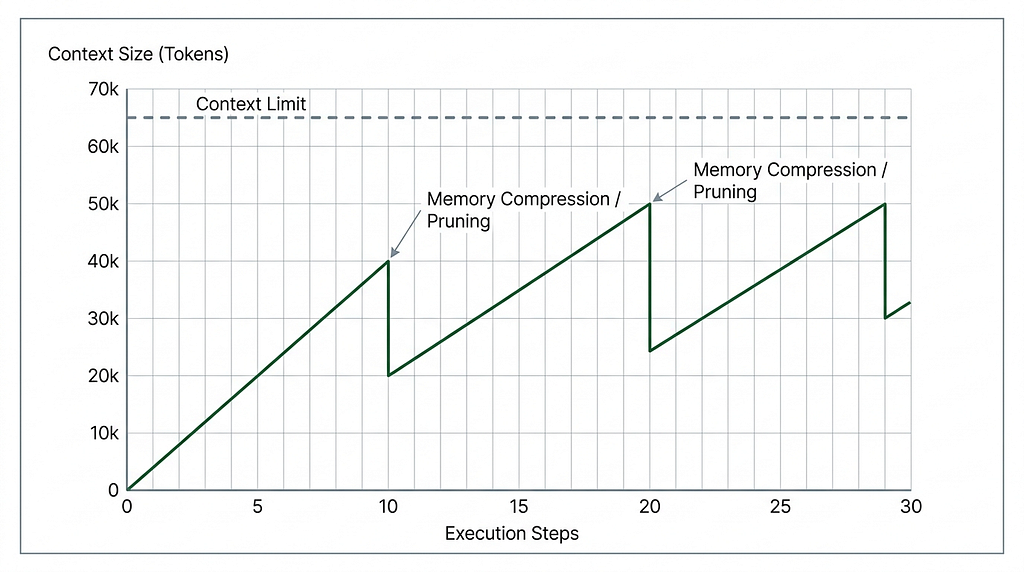
You can expose two tools to the LLM to “start focus” and “complete focus.” When your agent is about to start a complex sub-task, it can call start focus to checkpoint the context. Then, once it finishes, it can call complete focus to summarize what it learned. The harness can then prune all of the messy details like logs from the context that is no longer needed.
This creates a sawtooth pattern in your token usage. You keep the context window focused on the active problem instead of dragging the entire history of the session along for the ride:
Applying what you’ve learned
Building agents that run for hours requires a different playbook than single-turn LLM development. Performance decays over long sequences, so trace-level telemetry is how you see what’s actually happening. Alphabetical tool sorting, relocating dynamic data, context compaction, and model routing together can cut API costs.
With the right evaluation strategy in place, you can deploy agents confidently in production. I’d love to compare notes on how you’re measuring your stack. Find me on LinkedIn, X, or Bluesky.
A Practical Guide to Evaluating Multi-Turn Agent Trajectories was originally published in Google Cloud – Community on Medium, where people are continuing the conversation by highlighting and responding to this story.
Source Credit: https://medium.com/google-cloud/a-practical-guide-to-evaluating-multi-turn-agent-trajectories-bc21042dbac8?source=rss—-e52cf94d98af—4
About the Author