
Building an AI-Powered Energy Simulation: A Deep Dive into the Google Cloud Ecosystem with Gemini and BigQuery
1. Introduction: Why I Started This Project
I am a data analyst who recently relocated from Japan to the historic town of Shrewsbury, UK.
Back in Japan, I built my career as an independent contractor, specializing in data measurement and strategy. I was frequently brought in by Google Analytics partner agencies to lead technical projects for their high-profile clients — ranging from major telecommunications companies and publishers to brokerage firms. My career has been built in the “engine room” of data — diving into complex structures to bridge the gap between raw numbers and business strategy.
Currently, I am living in the UK under a visa that does not permit employment. While I cannot take on professional work, my passion for data hasn’t faded. Every now and then, I feel an irresistible urge to “get my hands dirty” with a dataset. It is more than just a job; it’s my craft.
And what better sandbox to play in than Google Cloud, a platform I’ve trusted and grown with throughout my career?
My new home, Shrewsbury, is an enchanting place. Its charming half-timbered houses, historic red-brick buildings, and the River Severn create a truly unique landscape. However, as I walked through these historic streets, I noticed a modern challenge: the Energy Performance Certificate (EPC) rating.
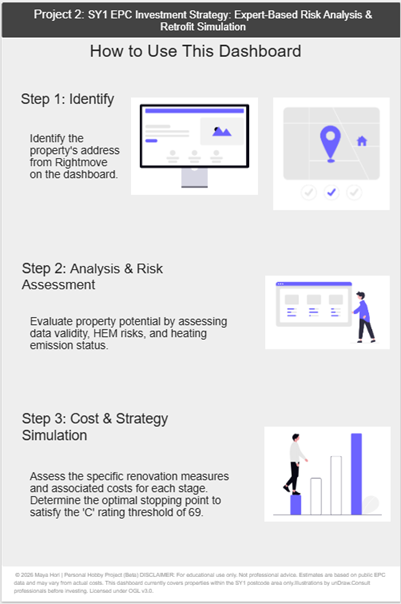
The UK government has set an ambitious goal for nearly all domestic properties to reach an EPC rating of ‘C’ or higher in the near future. To my surprise, I found that many buildings in my beloved town center fall significantly short of that ‘C’ rating.
To bridge this gap, I decided to take the EPC open data for the Shrewsbury SY1 district and build a simulation. By aligning the surveyor’s step-by-step recommendations with estimated point improvements and indicative costs, I aimed to create a tool that shows exactly what it takes, property by property, to reach that elusive Grade C.
2. The Challenge: Data Complexity & Technical Boundaries
Data isn’t always clean, especially when dealing with public government records. In the EPC dataset, I faced a significant granularity issue: the main certificate table is “one row per property,” while the recommendations table is “multiple rows per property.”
To turn these disjointed tables into a single renovation roadmap, I had to overcome “dirty” data — handling inconsistent formatting and ensuring data integrity before any analysis could begin. My role was to define the measurement logic clearly, ensuring that KGIs and KPIs were at the forefront before a single row of data was ever processed.
3. The Solution: AI-Human Collaboration
Consulting Gemini allowed me to troubleshoot cryptic errors and iterate on complex SQL logic at 10x speed. However, the secret to this partnership was having a clear image of the desired output.
AI is a powerful multiplier, but it still requires a human at the helm. Without a foundational understanding of data structures and a clear vision of the final dashboard, the AI’s potential would have remained untapped. It is the synergy between human curiosity and machine efficiency that truly drives innovation.
4. Technical Architecture: From Raw Data to Insights
I still remember the sinking feeling when my first complex query hit a ‘Region Error’ after I’d spent an hour structuring it. It was a humble reminder that no matter how much AI helps, the analyst must still navigate the physical boundaries of the cloud.
Despite those minor setbacks, I designed a classic, serverless, and highly scalable three-tier architecture on Google Cloud to transform millions of rows of open data into a responsive simulation tool:
- Google Cloud Storage (GCS): Used as a landing zone to ensure ingestion stability for massive datasets.
- BigQuery: Where the heavy lifting happened. I used SQL Views and functions like SAFE_CAST and STRING_AGG to transform messy raw data into a clean, actionable simulation layer.
- Looker Studio: The final visualization layer for interactive exploration.
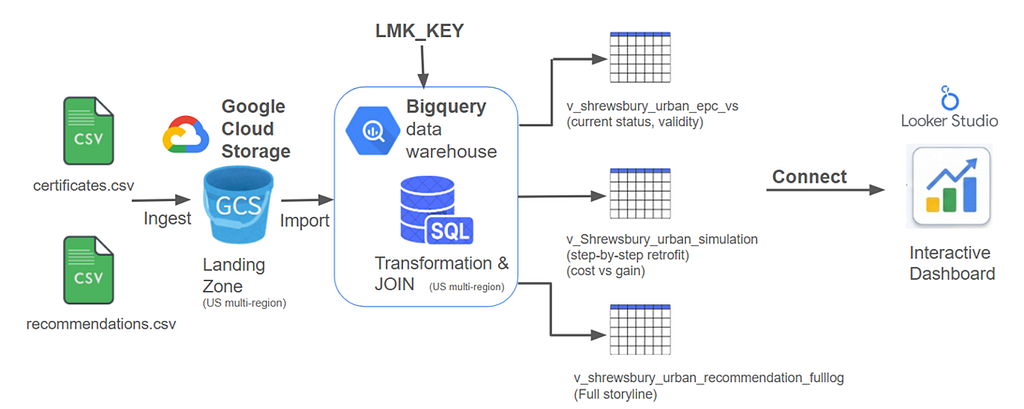
Layer 1: Ingestion (Google Cloud Storage)
The journey begins by uploading the raw certificates.csv and recommendations.csv to Google Cloud Storage (GCS).
Initially, I attempted to upload the files directly to BigQuery via the browser interface. However, due to the massive file sizes, the process was unstable and frequently timed out. To overcome this, I utilized GCS as a “Landing Zone.” Once the data is in GCS, the transfer to BigQuery stays within the Google network, making the ingestion process incredibly fast and reliable. It was a classic case of “more haste, less speed” — taking the extra step saved time in the long run.
Layer 2: Storage & Transformation (BigQuery)
This is the heart of the project. Rather than creating multiple static tables, I leveraged SQL Views to maintain a dynamic and flexible data model. Through a “pair-programming” process with Gemini, I shared my desired schema and asked for a robust way to handle dirty data without failing the query. Together, we tackled two major technical challenges:
① Ensuring Data Integrity with SAFE_CAST To avoid import failures, I initially ingested all raw data as STRING types. Once in a View, I needed to convert these into usable numbers and dates. Gemini suggested using the SAFE_CAST function, which became my best friend, allowing the query to continue gracefully even if it encountered unexpected characters or malformed text in the government dataset.
-- Ensuring Data Integrity
-- in BigQuery
SELECT
  LMK_KEY,
  -- Gracefully handles
  -- non-numeric strings
  SAFE_CAST(
    CURRENT_ENERGY_EFFICIENCY
    AS INT64
  ) AS current_score,
  SAFE_CAST(
    POTENTIAL_ENERGY_EFFICIENCY
    AS INT64
  ) AS potential_score
FROM
  `your_project.dataset.table`
Code by author. SQL implementation of the simulation logic.
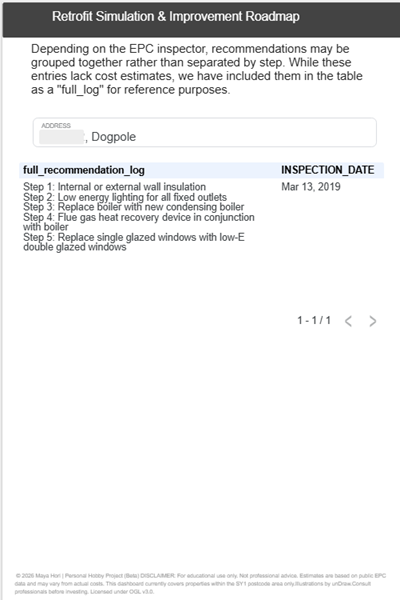
② Harmonizing Data Grain with STRING_AGG The biggest hurdle was the mismatch in data granularity: the Certificates data has one row per property, while the Recommendations data has multiple rows per property. To resolve this, I consolidated the multiple suggestions into a single “Renovation Roadmap” log.
-- Consolidate multiple recommendations
-- into a single "Roadmap" string
-- separated by " > " to show the
-- sequence of improvements.
SELECT
  LMK_KEY,
  STRING_AGG(
    improvement_descr, ' > '
    ORDER BY sequence_number
  ) AS renovation_roadmap
FROM
  `your_project.recommendations_table`
GROUP BY
  LMK_KEY
Code by author. SQL implementation of the simulation logic.
Layer 3: Visualization & Practical UX (Looker Studio)
Finally, I connected the refined BigQuery Views to Looker Studio. By performing the heavy lifting (joins and calculations) within BigQuery, the dashboard remains snappy and responsive.
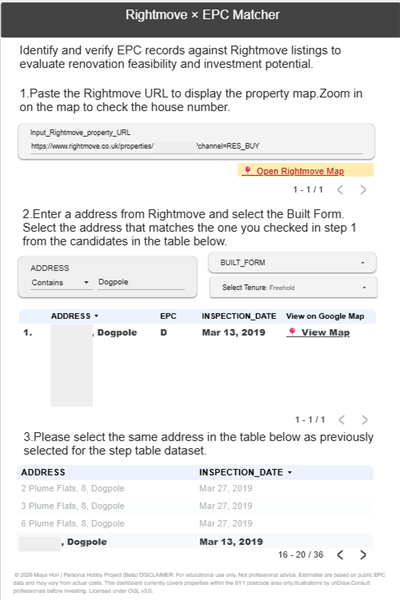
I also added a “secret ingredient” to improve real-world utility. Since property portals like Rightmove often withhold exact house numbers, I created a calculated field in Looker Studio to generate a direct link to Google Maps.
-- Dynamic Google Maps Link
-- Connecting data to physical locations
HYPERLINK(
  CONCAT(
    "http://maps.google.com/maps?q=",
    ADDRESS1,
    ",",
    POSTCODE
  ),
  "View on Map"
)
Code by author. Calculated fields in Looker Studio.
This small bridge turned “data points” into “real homes.”
By leveraging Looker Studio’s native calculated fields with dynamic Google Maps URLs, I was able to instantly cross-reference EPC data with Rightmove’s vague map pins. This feature, born out of an analyst’s obsession with connecting data to reality, turned an abstract street corner in Shrewsbury into a tangible 3D street view.

5. Results & Visualizations: Turning Data into Decisions
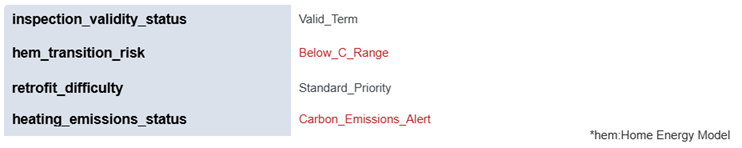
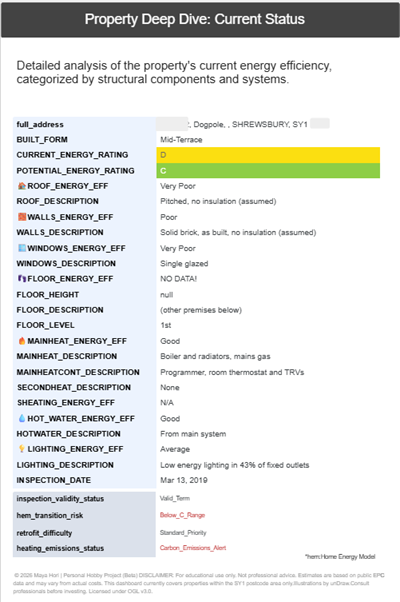
The final dashboard provides an instant “Health Check” for any property in the SY1 district. I developed four specialized fields to evaluate a property’s future-readiness:
- Inspection validity status: Tracks the 10-year EPC expiry. This flag alerts users when a fresh survey is required.
- Hem transition risk: Assesses readiness for the transition to modern heating standards.
- Retrofit difficulty: A rating of how challenging structural changes will be.
- Heating emissions status: Evaluates the environmental impact of the current system.
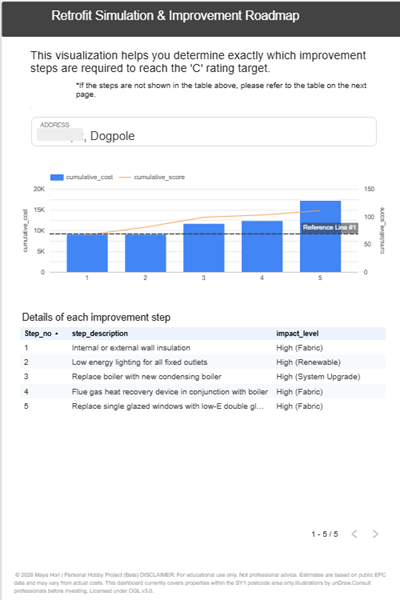
The Cost vs. Impact Simulation: By combining a bar chart (Cumulative Cost) with a line chart (Score Progression) and drawing a reference line at score 69 (Grade C), I can instantly see exactly which renovation step — and at what total cost — a property will meet the target.

6. Conclusion: Why I Keep Getting My Hands Dirty with Data
To be honest, this project was a lifeline for me. Moving to a new country can feel isolating, but diving into the UK’s open data made me feel connected to my new home. I found myself completely absorbed in the trial and error of structuring data — it was pure fun.
My time with Gemini was also a revelation. We didn’t just talk about SQL; we talked about my favorite TV shows. Discussing the themes of Westworld with an AI was a surreal and fascinating moment of “life imitating art.”
But it also left me with a profound realization. While AI can handle the technical heavy lifting, the ultimate vision and the human context must come from us. Gemini can brilliantly optimize my SQL, but it cannot feel the cold draft of a historic Shrewsbury home on a winter morning, nor can it understand the human warmth of saving it. That context belongs solely to the analyst.
Now, when I walk through the historic streets of Shrewsbury and admire the beautiful brickwork of an old building, I’m not just seeing a wall — I’m guessing its age, its structural boundaries, and its potential EPC rate. My visa might currently restrict me from professional employment, but it cannot restrict my passion.
Wherever I go next, I am ready to get my hands dirty again. I simply love working with data.
Building an AI-Powered Energy Simulation: A Deep Dive into the Google Cloud Ecosystem with Gemini… was originally published in Google Cloud – Community on Medium, where people are continuing the conversation by highlighting and responding to this story.
Source Credit: https://medium.com/google-cloud/building-an-ai-powered-energy-simulation-a-deep-dive-into-the-google-cloud-ecosystem-with-gemini-e03714000c8c?source=rss—-e52cf94d98af—4


