
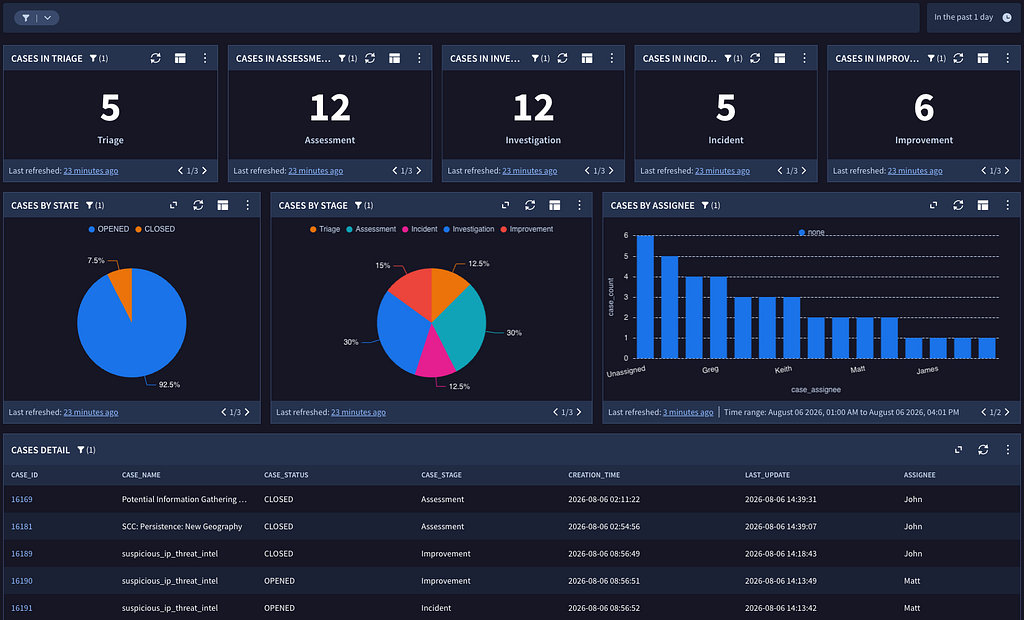
Today, we are going to build a set of metrics in a dashboard using the cases dataset. These metrics will then be used with the case detail chart at the bottom of the page to highlight how drilldowns could be used in Google Security Operations (SecOps). The concepts can be applied to other datasets as well! The json of the dashboard has been posted to GitHub so if you want to import the json to your tenant and play around with it, go right ahead!
The dashboard we are going to leverage contains a set of charts (bar, metrics and pie) that provide us insight to the status (open or closed), stage (triage, assessment, investigation, incident and improvement) and assignee of the case. The stages are a set of default stages in SecOps but they can be modified to suit the organization.
The top row of charts each contain a metric for a stage with the number of cases for the past day. The time range has been set using the global time filter for the dashboard and its charts. In the middle are visuals to represent the case status, stage and assignee. Finally at the bottom is a tabular view of the cases with key values like the case ID, the case name and when it was created and last updated.
Before we dive in, I will mention that you will want to make sure that filters have been set up for the status, stage and assignee ahead of building the drilldowns. In edit mode, you can access the filters by clicking the Manage Filters button. The drilldown that applies a filter depends on this existing.
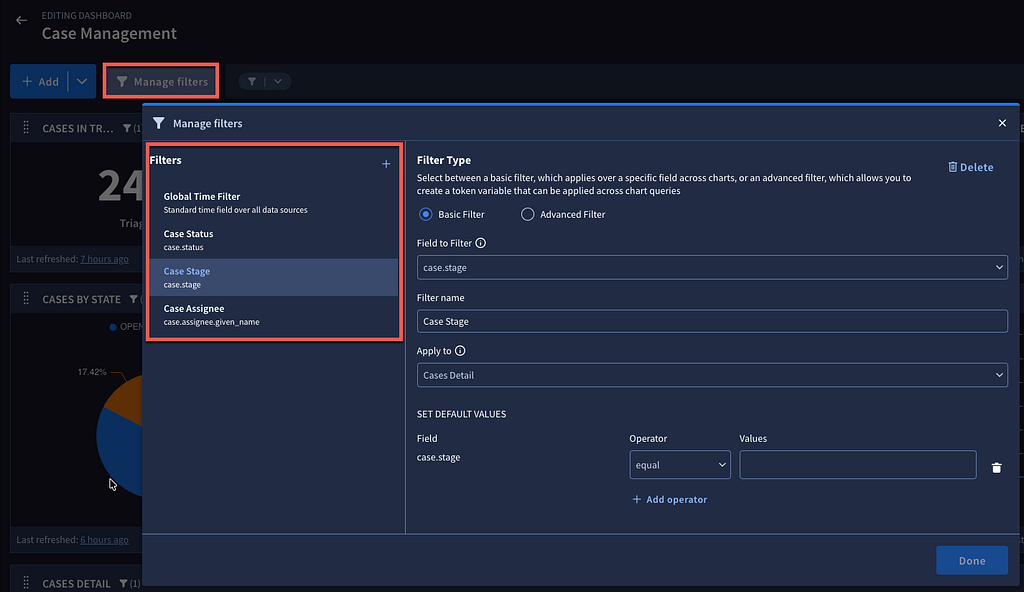
If you decide to import the json and follow along, no worries, the filter is already there. However, if you build this or some variation from scratch, the filter will need to be available so it can then be called from the drilldown.
Building A Drilldown in a Chart
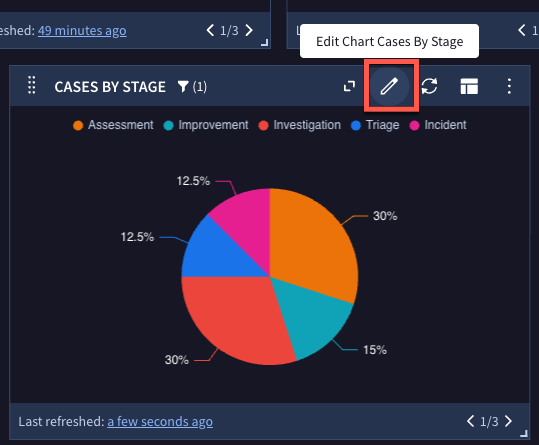
There are a few different options available for drilldowns including a system level drill-down that I will cover in a little bit. At a high level, a drilldown can apply a filter to the current dashboard, execute a search or open an external link. Each chart can have a single left click drilldown, but can have multiple right click drilldowns. We are going to view a pie chart with the cases aggregated by stage and then counted. To add a drilldown, we need to place the dashboard in edit mode and then edit the specific chart by clicking on the pencil.
In the chart editor, the underlying query is displayed at the top of the page. This query returns the case stage and a count. It’s pretty straightforward.
$case_stage = case.stage
match:
  $case_stage
outcome:
  $case_count = count(case.stage)
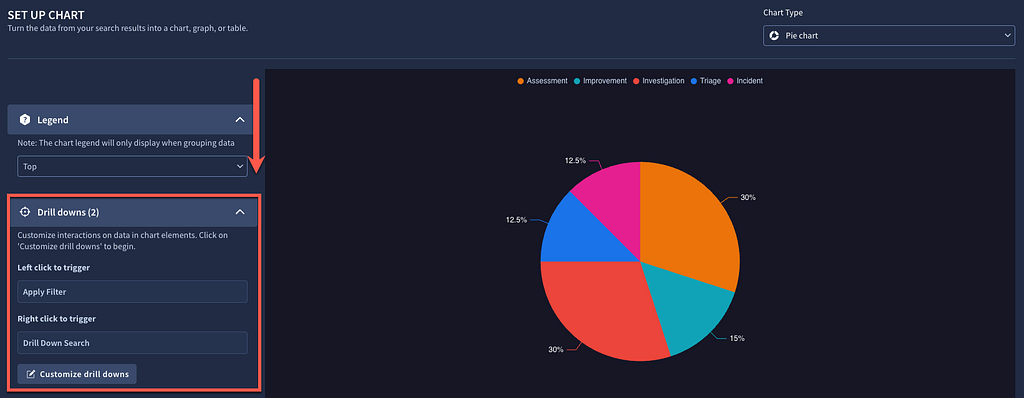
Scrolling down, we can see the chart setup and on the left side of the page are controls to set the layout of the chart. At the bottom of this list is a section named Drill downs. To create, modify or delete a drilldown, click the customize button in this section.
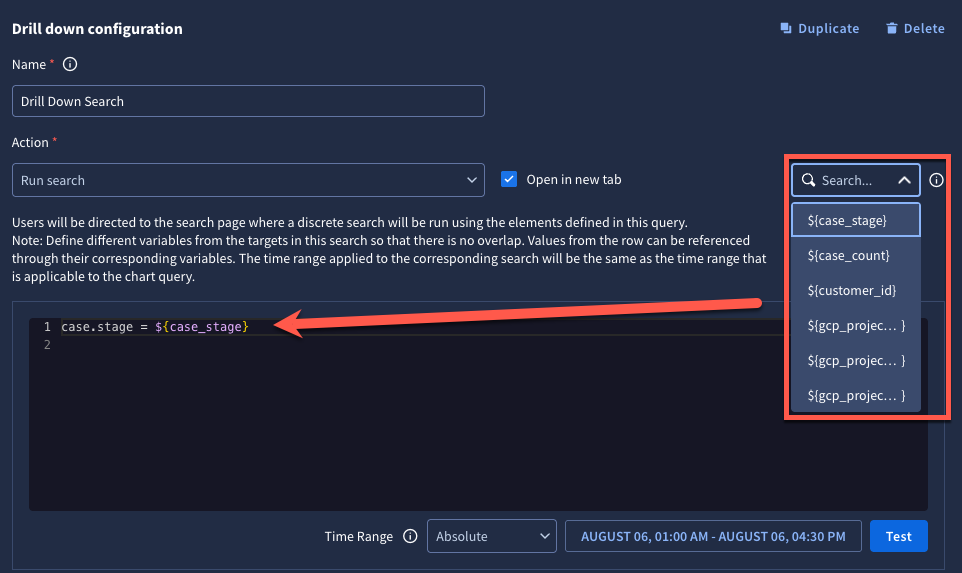
A pop-up will appear and in this example, we have a drilldown to Run search and another to Apply dashboard filter. In the run search option, we can pass the parameter of the case stage, which was in the match section of the underlying query into the drilldown. The parameters available are listed in the dropdown for easy access.
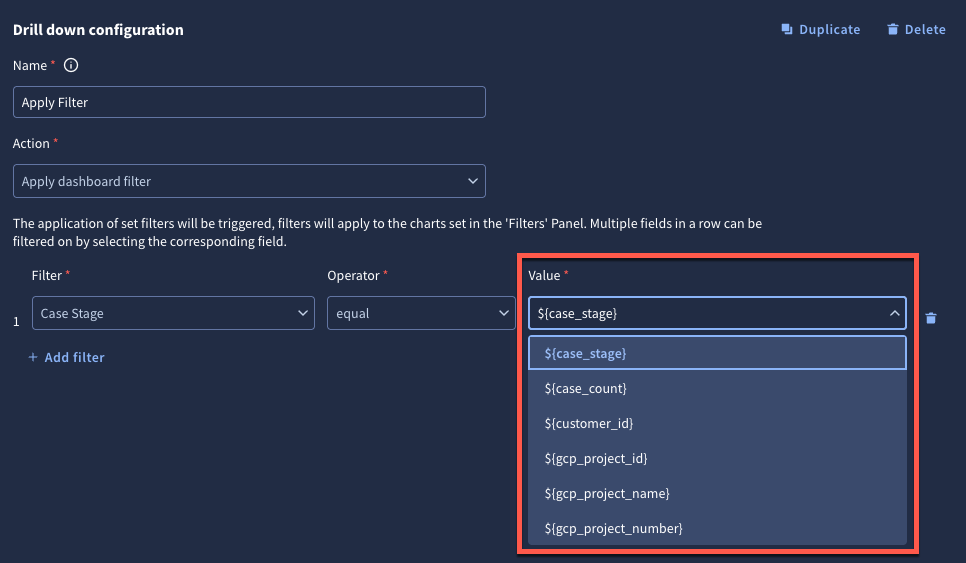
In the apply dashboard filter option, we can use those parameters again to apply the case stage to a filter condition.
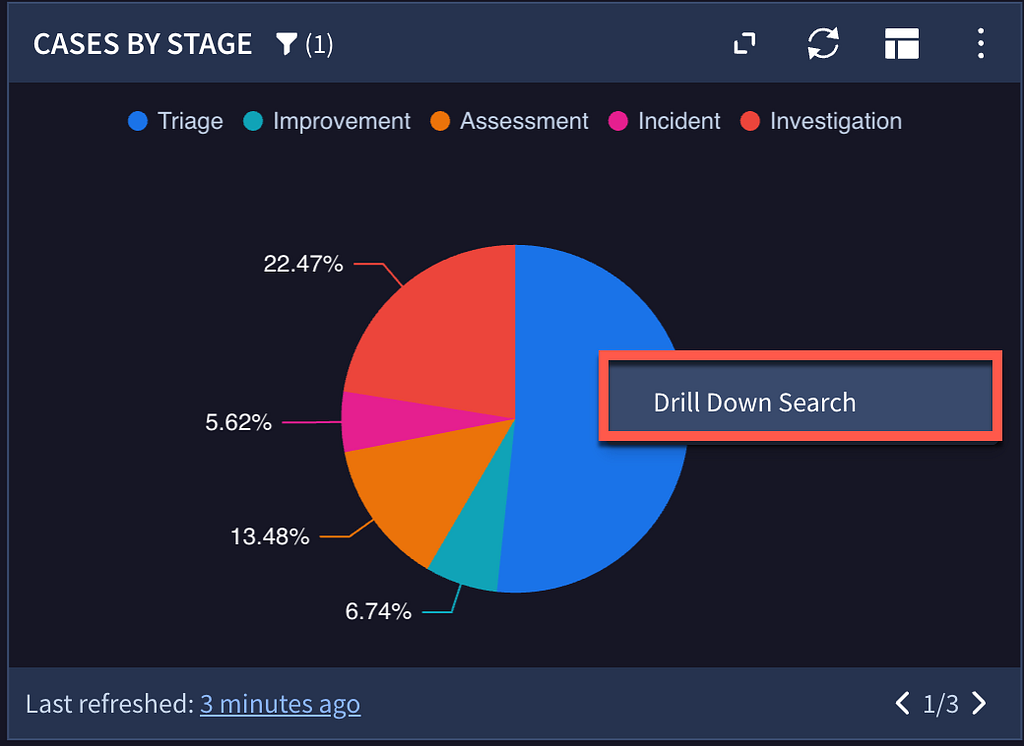
With the modifications made to the drilldowns, we can save the chart. Once done, right clicking on the pie-chart opens a context menu with the new drill-down options.
Remember we can duplicate charts to build out other charts, but the general process we just followed would be applied to the other charts we have for the status and the assignee charts.
Tips for Building Metric Values
OK, I said general process because I have a few tips that I want to share that will hopefully make your building of individual metrics a bit simpler. Let’s take a look at the chart that builds the metric for the number of cases in the investigation stage.
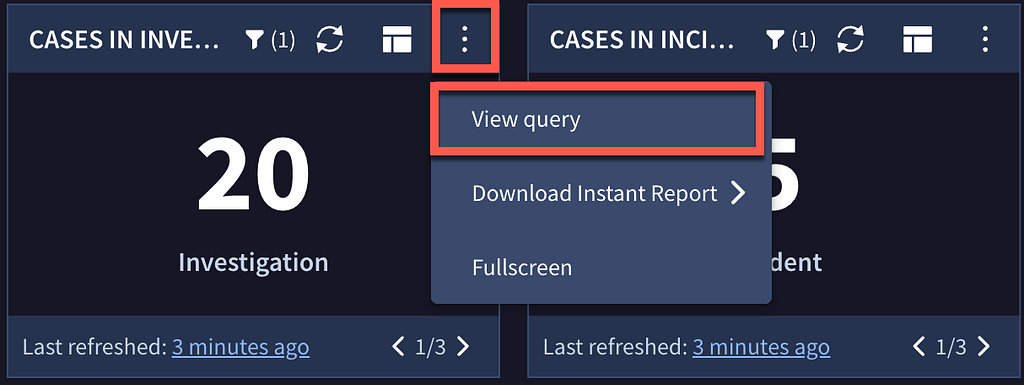
The query again is pretty simple, but there are a few differences between this one and the previous chart. Here are the queries side by side for comparison.
Cases in Investigation (Metric)
Cases By Stage (Pie Chart)
case.stage = “Investigation”
outcome:
$case_count = count(case.name)
$case_stage = array_distinct(case.stage)
$case_stage = case.stage
match:
$case_stage
outcome:
$case_count = count(case.stage)
The first is that there isn’t a match section in the query. That’s fine, the cases being returned have a specific stage, so just calculating the count without an aggregation seems like a good thing to do.
The other second item to call out is that rather than performing a count on the stage or status where we aggregated that value and then counted it, we are counting the name field which is a unique GUID for a case. We do this in the curated dashboards we publish and this works nicely to display a value of 0 when there are no cases in a particular stage, so I’d recommend using that outcome variable statement, particularly with the chart type of metrics.
The final item isn’t important for the chart, but is important for the drilldown. Here we included a second outcome variable to hold the value of the stage. We don’t need this for the metric chart, we have logic that states we just want the stage of investigation, but remember that in statistical searches, the match and outcome variables are the only values available and by adding an outcome variable for the stage here, we are essentially banking this value.
In the drilldown configuration, we can see both outcome variables are available for our use. This is how we are able to take a metric and drilldown to search for cases in the investigation stage despite the only visible output in the chart being a number. Notice in the list the two values displayed are the two outcome variables from the query. OK, yes there are a few others but they pertain to information about the GCP project.
Using the Drilldowns
Let’s test the drilldown using the metric for the stage named incident. We used the same concepts that we just covered and when we right click on the metric we get drilldown options. Because we only have one right click drilldown defined, we only have one choice which is the search.
When I click on it, the stage associated with this query is passed to my very simple query and I get a tabular list of cases in the search interface. This is the same search interface we used for events, entity graph and detections. Notice we can click the columns button and add additional columns and save those column sets. On the left of each case is a hyperlink of the ID which can be used to navigate to the case view.
Let’s use the other drilldown we created which applies a dashboard filter. We are going to left click on the metric for assessment. Because we can only have one drilldown for a left click, the option like we saw for the right click isn’t there, the drilldown just happens.
This drilldown applies a dashboard filter (Case Stage = Assessment), so the first thing we should see is a new inline filter at the top of the dashboard. When this filter is applied, the Case Detail chart at the bottom of the dashboard updates based on the addition of this filter. Just a quick side note, this chart has been set up to accept filters for the stage, status and assigned user previous to the creation of the drilldowns using “Manage filters” on the Editing Dashboard page.
This table now only lists cases where the stage is Assessment. Clicking on other charts can add additional filters to this case detail list and the Clear All button can be used to revert back to the original dashboard view.
Notice in the case detail table that the CASE_ID field (case.response_platform_info.response_platform_id) is displayed as a hyperlink. Clicking this will take you to the case selected in the case management section of SecOps. This is a variation of the drilldowns that we’ve already observed and is provided by the system as a pivot point into cases. In other dashboards this can be a pivot to the detections page as well as other locations. The curated dashboards provide some good examples of these system defined drilldowns.
With that, let’s wrap up this blog on adding drilldowns to dashboards. As you start using drilldowns, here are a few things to keep in mind:
- Drilldowns can be used to apply dashboard filters, run searches or go to an external link
- The match and outcome variables from the underlying chart can be passed to these drilldowns
- The outcome variable, like we highlighted in the metric example, doesn’t need to be used in the chart but can be made available for the drilldown
- Other charts in the dashboard can be linked to a filter so a metric could be clicked on and another chart in that dashboard uses that filter
I hope this example provides you with additional ideas on how you can use dashboards in Google SecOps!
New to Google SecOps: Drilling Down the House was originally published in Google Cloud – Community on Medium, where people are continuing the conversation by highlighting and responding to this story.
Source Credit: https://medium.com/google-cloud/new-to-google-secops-drilling-down-the-house-777b1779b0f1?source=rss—-e52cf94d98af—4
About the Author