
Tracing AI Agents from Prompt to Execution with SQLCommenter
Written by:
- Parth Ajmera & Shubham Palriwala, Founders @ Agnost AI (LinkedIn)
- Anubhav Dhawan, Software Engineer @ Google (LinkedIn)
A few weeks ago, we shared how MCP Toolbox for Databases delivers end-to-end distributed tracing from the client SDK through to the server, with spans, metrics, and full OpenTelemetry MCP semantic-convention compliance. It turned slow tool-call debugging into single-trace diagnosis.
But the trail went cold at the database boundary. The server span ended, the query executed, and your DBA was left holding a slow query log with no way to tie it back to the agent prompt that triggered it.
Today, we close that final gap. In collaboration with Agnost AI, MCP Toolbox now integrates SQLCommenter, Google’s open source SQL instrumentation library, so OpenTelemetry trace context and application metadata flow all the way down into the SQL statement itself. You can now click from an agent prompt to the exact query plan it caused.
The Last Mile Problem
Consider Alex. Their p95 latency alert fires. The trace tells them the slowdown is on the database side rather than in the network or server. Big improvement over last quarter.
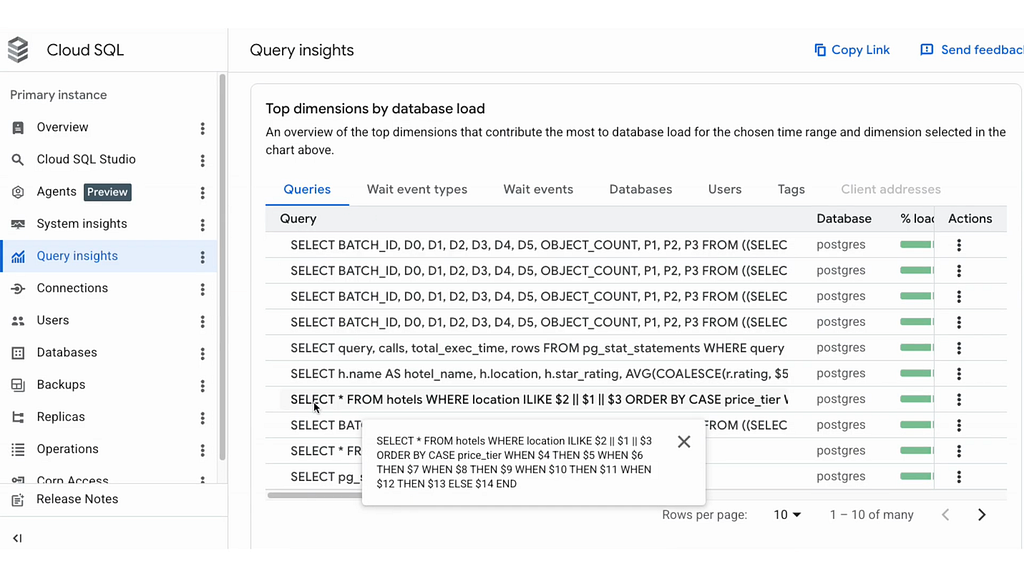
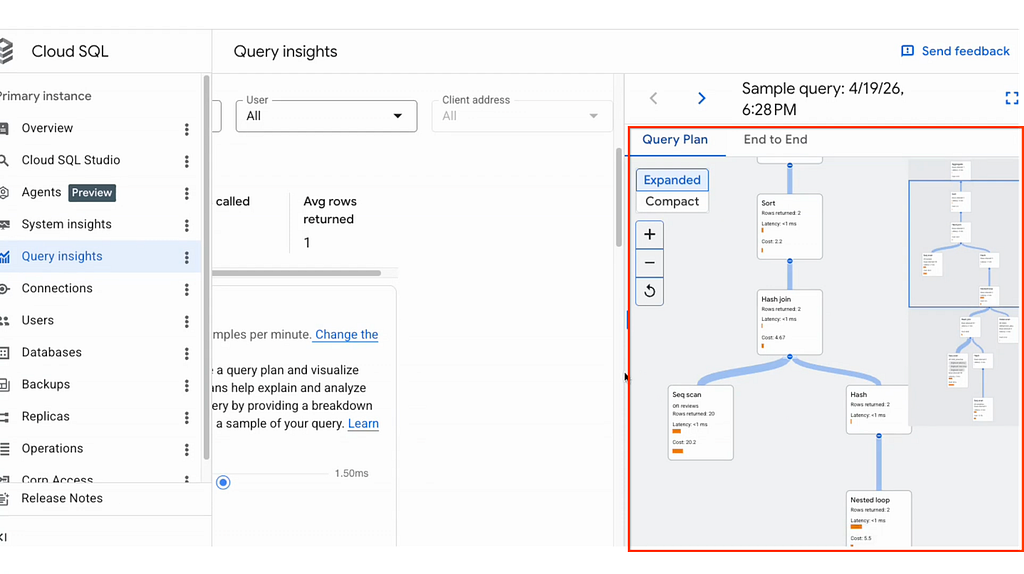
Then Alex opens Google Cloud Trace and Cloud Logging (Logs Explorer) to investigate the offending query. While Cloud SQL Query Insights is great for aggregating query plans, it normalizes queries and strips comments. Cloud Logging, however, captures the raw SQL statement exactly as it was sent to the database. But traditionally, looking at the raw SQL gives you no way to know which agent, which user, or which tool call produced it. The database is a different observability silo: it speaks SQL, not OTel. Joining the two has historically meant custom middleware, log-timestamp correlation, or just giving up.
SQLCommenter solves this by writing the trace context directly into the SQL statement as a structured comment. The database engine ignores the comment for execution but logs it verbatim, so query logs and slow query reports in Cloud Logging can seamlessly correlate back to the original distributed trace.
What SQLCommenter Looks Like on the Wire
With SQL Commenter enabled for a source in your MCP Toolbox configuration, every executed statement gets a comment prepended with attributes sorted alphabetically. Keys and values are URL-encoded. Shown below decoded for readability:
/*
  client='toolbox-core-python/v0.5.0',
  client.agent.id='support-agent-v1',
  client.model='gemini-3.5-flash',
  client.user.id='user-123',
  db.system.name='postgresql',
  server='genai-toolbox/0.5.0',
  tool.name='search_hotels',
  traceparent='00–4bf92f3577b34da6a3ce929d0e0e4736–00f067aa0ba902b7–01'
*/

SELECT * FROM hotels WHERE city = 'San Francisco'
The traceparent is a W3C-standard distributed tracing identifier. The client.* attributes describe who called the database, with what model, and under whose identity. Every one of these is searchable in your database query log.
A Developer-First API: TelemetryAttributes
The feature ships in the Python SDK as a typed Pydantic class plus a single immutable setter on ToolboxTool. Three user-facing fields exist in v1: the LLM model that generated the call, the end-user ID, and the agent ID. client.name and client.version are filled in automatically by the SDK transport, so you do not have to repeat them on every call.
from toolbox_core import ToolboxClient, TelemetryAttributes

client = ToolboxClient(url="http://localhost:5000")
tool = await client.load_tool("search_hotels")

# Attach attributes for a specific agent/user context. Returns a new
# tool; the original is untouched and safe to share across requests.
scoped = tool.add_telemetry_attributes(
 TelemetryAttributes(
 llm_model="gemini-3.5-flash",
 user_id="user-123",
 agent_id="support-agent-v1",
 )
)

result = await scoped(city="San Francisco")
Under the Hood: Riding the MCP _meta Field
We did not add new parameters to tool schemas. Doing so would pollute tool definitions and break the principle that tool arguments are part of the model’s contract. Instead, the attributes travel in the _meta field of the tools/call request, the same channel that already carries traceparent. This keeps us fully aligned with the MCP specification.
{
   "jsonrpc":"2.0",
   "id":1,
   "method":"tools/call",
   "params":{
      "name":"search_hotels",
      "arguments":{
         "city":"San Francisco"
      },
      "_meta":{
         "traceparent":"00–4bf92f3577b34da6…-00f067aa0ba902b7–01",
         "tracestate":"…",
         "dev.mcp-toolbox/telemetry":{
            "client.name":"toolbox-core-python",
            "client.version":"v0.5.0",
            "client.model":"gemini-3.5-flash",
            "client.user.id":"user-123",
            "client.agent.id":"support-agent-v1"
         }
      }
   }
}
On the server, a single shared helper builds the comment for every supported SQL source (Postgres, MySQL, SQLite, AlloyDB, and friends). You can enable this feature on a per-source basis by simply setting sqlCommenter: true directly in your tools.yaml configuration. Crucially, this is independent of the OpenTelemetry exporters (–telemetry-otlp and –telemetry-gcp): you can enable OTel tracing without writing comments into SQL, write comments without exporting OTel, or both.
The Result: One Trace, End to End
With SQLCommenter wired in, a single agent prompt now produces a continuous chain of correlated telemetry:
tools/call search-hotels (CLIENT, trace=t1, span=s1)       # Toolbox SDK
  └─ toolbox/server/mcp/http (SERVER, trace=t1, span=s2)   # Toolbox server
    └─ tools/call search-hotels (SERVER, trace=t1, span=s3)
      └─ SQL: /* traceparent=t1-…, client.user.id=user-123 … */
         SELECT * FROM hotels …
          │
          ▼
    postgres query plan
    (slow query log entry carries traceparent=t1-…)
The same trace ID Alex saw in their alerting dashboard is now present in the database’s slow query log. One click takes Alex from “the p95 spiked” to “this exact query, called by support-agent-v1 on behalf of user-123, doing a sequential scan because the index is missing”. The silo between application telemetry and database query logs is gone.
Seeing It In Action
To see this end-to-end flow in action, we can look at the raw telemetry and log outputs.
OTel Trace attributes
When the span arrives in your tracing backend (like Google Cloud Trace, Jaeger, or Datadog), the custom attributes are attached directly to the tool execution span. The unique Trace ID ties everything together.
{
   "traceId":"4bf92f3577b34da6a3ce929d0e0e4736",
   "spanId":"00f067aa0ba902b7",
   "name":"tools/call search_hotels",
   "attributes":{
      "dev.mcp-toolbox/telemetry":{
         "client.name":"toolbox-core-python",
         "client.version":"v0.5.0",
         "client.model":"gemini-3.5-flash",
         "client.user.id":"user-123",
         "client.agent.id":"support-agent-v1"
      }
   }
}
Correlated Query in Database Logs
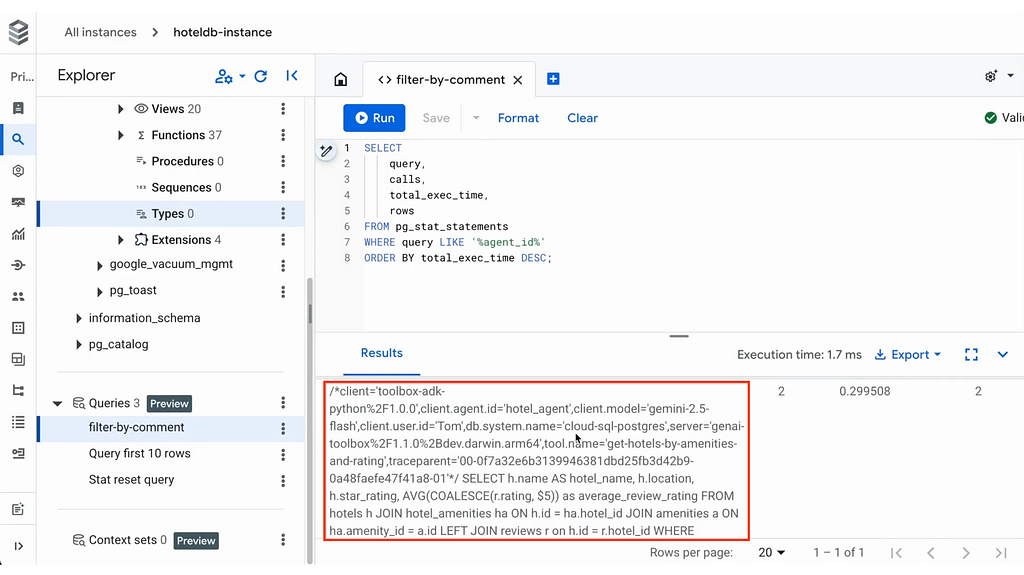
To capture the query, ensure your database is configured to log statements (like log_statement = 'all' in Postgres). When you query your log aggregator (like Google Cloud Logging) for the specific traceId, you will find the raw SQL statement with the SQLCommenter block preserved verbatim:
2026–06–18 10:00:00 UTC [12345]: [user-123@hotels_db] LOG: duration: 1450.23 ms statement:

/*
  client='toolbox-core-python%2Fv0.5.0',
  client.agent.id='support-agent-v1',
  client.model='gemini-3.5-flash',
  client.user.id='user-123',
  db.system.name='postgresql',
  server='genai-toolbox%2F0.5.0',
  tool.name='search_hotels',
  traceparent='00–4bf92f3577b34da6a3ce929d0e0e4736–00f067aa0ba902b7–01'
*/

SELECT * FROM hotels WHERE city = 'San Francisco'
Getting Started
1. Upgrade your SDK and server:
pip install - upgrade "toolbox-core[telemetry]"
2. Add sqlCommenter config for the datasource:
# In tools.yaml

sources:
- name: my-db
type: postgres
# …
sqlCommenter: true
3. Start your server with telemetry enabled:
./toolbox - telemetry-otlp="https://your-otel-collector:4318"
4. Configure OpenTelemetry for your Python application using standard environment variables:
export OTEL_EXPORTER_OTLP_ENDPOINT="https://your-otel-collector:4318"
5. Initialize your client and attach context just before invocation:
from toolbox_core import ToolboxClient, TelemetryAttributes

client = ToolboxClient(
 url="http://localhost:5000",
 telemetry_enabled=True,      # Enable tracing
)

tool = await client.load_tool("search_hotels")

scoped = tool.add_telemetry_attributes(
 TelemetryAttributes(
 llm_model="gemini-3.5-flash",
 user_id="user-123",
 agent_id="support-agent-v1",
 )
)
result = await scoped(city="San Francisco")
Your trace will now stretch all the way from the agent prompt down into the database’s slow query log entry.
Get Involved
The MCP governance committee recently highlighted audit trails and observability as a critical gap for enterprise readiness, calling for:
“end-to-end visibility into what a client requested and what a server did, in a form enterprises can feed into their existing logging and compliance pipelines.”
Our SQLCommenter integration is a massive leap toward that vision, and we’re thrilled to announce that it is officially released and ready to use! It’s available right out of the box for MCP Toolbox.
Read the full SQLCommenter integration docs to get started.
Tell us what your observability stack is missing. Reach us on GitHub, Discord, or in the comments below.
Who Wrote That Query? was originally published in Google Cloud – Community on Medium, where people are continuing the conversation by highlighting and responding to this story.
Source Credit: https://medium.com/google-cloud/who-wrote-that-query-36beb1ddfc99?source=rss—-e52cf94d98af—4


