Mastering Observability in Google ADK: Implementing OpenTelemetry for GCP Metrics, Traces, and Logging
Building autonomous generative AI agents using Google’s Agent Development Kit (ADK) is incredibly powerful. But as your LLM applications grow in complexity, understanding their reasoning, performance, and failure modes becomes a challenge. You can’t just rely on standard print statements when an agent autonomously decides which tools to use or how to break down a complex prompt.
To gain true visibility into your AI applications, you need robust observability. In this article, I will walk you through how to implement OpenTelemetry (OTel) in a Google ADK framework to export metrics, traces, and logging directly into Google Cloud Platform (GCP).
We will use the codebase from my GitHub repository (gcp-opentelemetry-llm-agent) to demonstrate how to instrument your agent.py and validate the data in the GCP Console.
Why OpenTelemetry for LLM Agents?
Generative AI agents operate non-deterministically. Without instrumentation, you have zero insight into token usage, latency bottlenecks, or why an agent hallucinated. OpenTelemetry provides a standardized, vendor-agnostic way to collect this telemetry data.
By integrating OTel with Google Cloud Observability, you can:
- Trace Agent Reasoning: Visualize the execution path of your agent, including sub-tasks and tool invocations.
- Monitor Metrics: Track token consumption, request latency, and custom metrics (like character or vowel counts).
- Centralize Logging: Correlate prompts and agent responses with specific trace spans for easy debugging.
Step 1: Setting Up the Dependencies
Before diving into the code, ensure your requirements.txt is updated with the necessary OpenTelemetry and GCP export libraries.
# requirements.txt
google-cloud-trace
google-cloud-monitoring
google-cloud-logging
opentelemetry-api
opentelemetry-sdk
opentelemetry-exporter-gcp-trace
opentelemetry-exporter-gcp-monitoring
opentelemetry-instrumentation-google-genai
Run pip install -r requirements.txt to pull in the dependencies.
Step 2: Instrumenting the Agent (agent.py)
The core of our observability setup lives in the agents/otel_agent/agent.py file. We need to initialize the OpenTelemetry providers and configure them to send data to GCP using the native exporters. We will also leverage the GoogleGenAiSdkInstrumentor to auto-instrument our model calls.
Here is how you can set up the tracing and metrics configuration:
# agents/otel_agent/agent.py
import os
from opentelemetry import trace, metrics
from opentelemetry.sdk.trace import TracerProvider
from opentelemetry.sdk.trace.export import BatchSpanProcessor
from opentelemetry.sdk.metrics import MeterProvider
from opentelemetry.sdk.metrics.export import PeriodicExportingMetricReader
from opentelemetry.sdk.resources import Resource

# GCP Exporters
from opentelemetry.exporter.cloud_trace import CloudTraceSpanExporter
from opentelemetry.exporter.cloud_monitoring import CloudMonitoringMetricsExporter
# Google GenAI / ADK Instrumentation
from opentelemetry.instrumentation.google_genai import GoogleGenAiSdkInstrumentor
def initialize_gcp_telemetry(project_id: str):
    # 1. Define the Resource (Identifies your agent)
    resource = Resource.create({
        "service.name": "otel-llm-agent",
        "service.version": "1.0.0"
    })
    # 2. Configure GCP Trace Exporter
    tracer_provider = TracerProvider(resource=resource)
    trace_exporter = CloudTraceSpanExporter(project_id=project_id)
    tracer_provider.add_span_processor(BatchSpanProcessor(trace_exporter))
    trace.set_tracer_provider(tracer_provider)
    # 3. Configure GCP Metrics Exporter
    metrics_exporter = CloudMonitoringMetricsExporter(project_id=project_id)
    metric_reader = PeriodicExportingMetricReader(metrics_exporter)
    meter_provider = MeterProvider(resource=resource, metric_readers=[metric_reader])
    metrics.set_meter_provider(meter_provider)
    # 4. Auto-Instrument the GenAI SDK
    GoogleGenAiSdkInstrumentor().instrument()

    return trace.get_tracer(__name__), metrics.get_meter(__name__)
# Initialize when the agent starts
tracer, meter = initialize_gcp_telemetry(os.getenv("GOOGLE_CLOUD_PROJECT"))
By calling GoogleGenAiSdkInstrumentor().instrument(), OpenTelemetry automatically formats prompts, responses, and multimodal data according to the GenAI semantic conventions, extracting attributes like gen_ai.usage.input_tokens and gen_ai.request.model.
Step 3: Tracking Custom Metrics
Metrics aggregate high-level numerical data over time, like request volume or token counts, you can use the OpenTelemetry Meter to create custom metrics like below.
# Create a custom counter metric
vowel_counter = meter.create_counter(
    "agent.response.vowel_count",
    description="Number of vowels generated in the agent's response"
)
def process_agent_response(response_text):
    # Calculate custom metric
    vowels = sum(1 for char in response_text.lower() if char in "aeiou")

    # Record the metric with attributes
    vowel_counter.add(vowels, {"model": "gemini-1.5-pro"})
Step 4: Tracking Custom Traces
Traces organize the execution path into a hierarchy of “Spans,” creating a clear “waterfall” view of the agent’s reasoning loop. You can add custom spans and attributes to track specific internal functions or tool invocations that auto-instrumentation might miss.
def execute_custom_tool(tool_input):
    # Start a custom span for a specific operation
    with tracer.start_as_current_span("execute_custom_tool") as span:
        # Add context to the span
        span.set_attribute("tool.input_length", len(tool_input))

        # Simulate tool execution
        result = f"Processed data: {tool_input}"

        span.set_attribute("tool.status", "success")
        return result
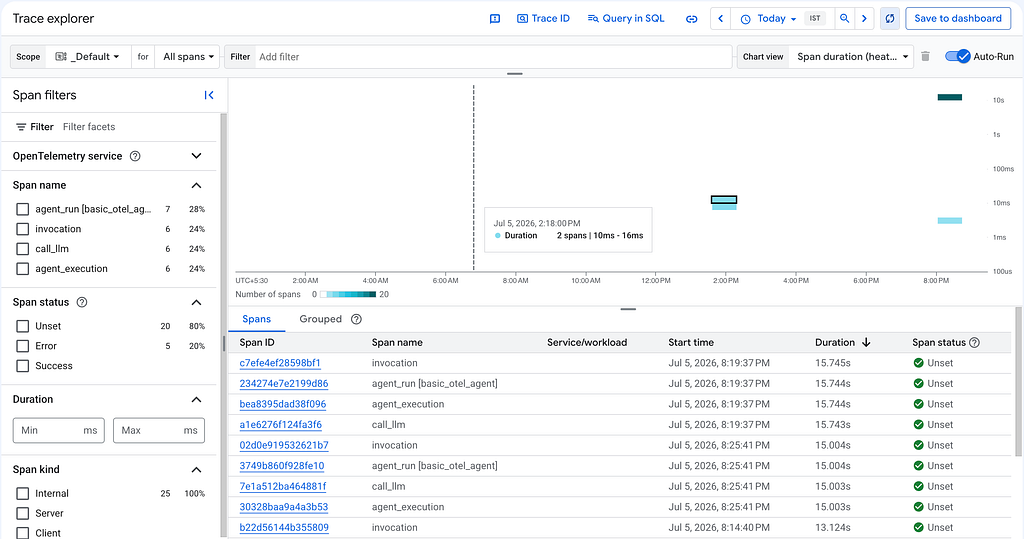
Note: Once exported, you can navigate to Cloud Trace in the Google Cloud Console to view the trace waterfall and visually inspect which spans are taking the longest, pointing you immediately to performance bottlenecks.
Step 5: Tracking Custom logs
Logs are detailed, timestamped records of discrete events. By default, sensitive data like prompt content and tool arguments might not be captured. You can enable capturing full prompts by setting the environment variable OTEL_INSTRUMENTATION_GENAI_CAPTURE_MESSAGE_CONTENT=true. This logs full prompt inputs and agent responses directly to Cloud Logging, which is highly useful for debugging.
To generate standard application logs that correlate with your active trace context:
import logging
import google.cloud.logging
from opentelemetry.exporter.cloud_logging import CloudLoggingHandler
# Attach Cloud Logging handler to standard Python logger
client = google.cloud.logging.Client()
handler = CloudLoggingHandler(client)
logger = logging.getLogger("gcp_agent_logger")
logger.setLevel(logging.INFO)
logger.addHandler(handler)
def log_agent_action(action, details):
    # Because of OTel, these logs will automatically inject the active trace_id
    logger.info(f"Agent Action: {action} - Details: {details}")
Visualizing Telemetry in the GCP Console
Once your agent is up and running, you can jump directly into the Google Cloud Console to view your performance data in real time.
1. Cloud Trace (Span Hierarchy)
In the Trace Explorer, you can visually track down bottlenecks by viewing the complete execution hierarchy of your agent, showing exactly how long your tool calls and LLM steps take.
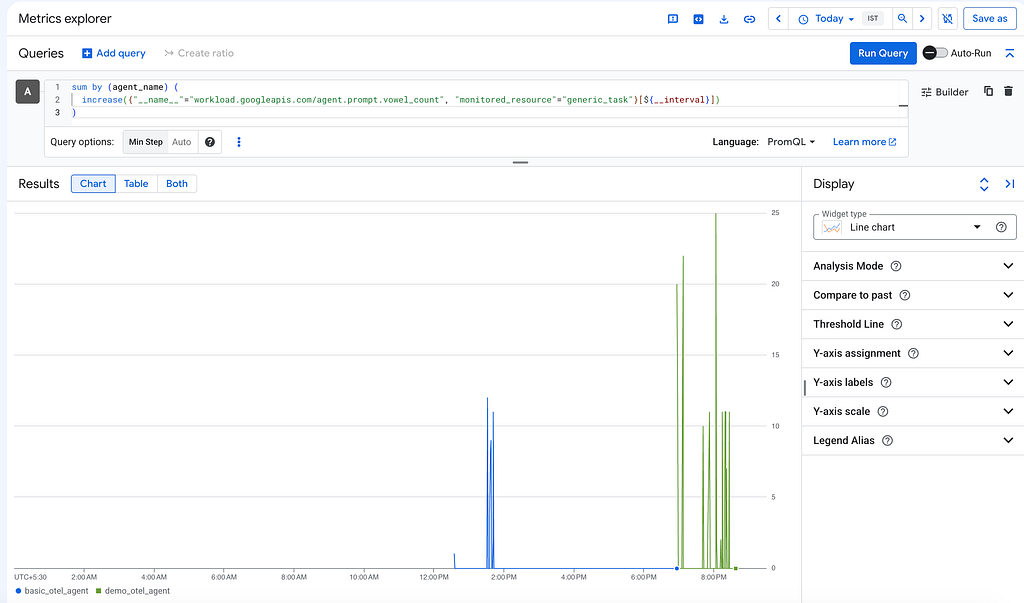
2. Cloud Monitoring (Metrics & PromQL)
Using the Metrics Explorer, you can write PromQL queries to build dashboards tracking custom counters, token distribution, or response rates.
#PROMQL
sum by (agent_name) (
  increase({"__name__"="workload.googleapis.com/agent.prompt.vowel_count", "monitored_resource"="generic_task"}[${__interval}])
)
3. Cloud Logging (Trace Context Correlation)
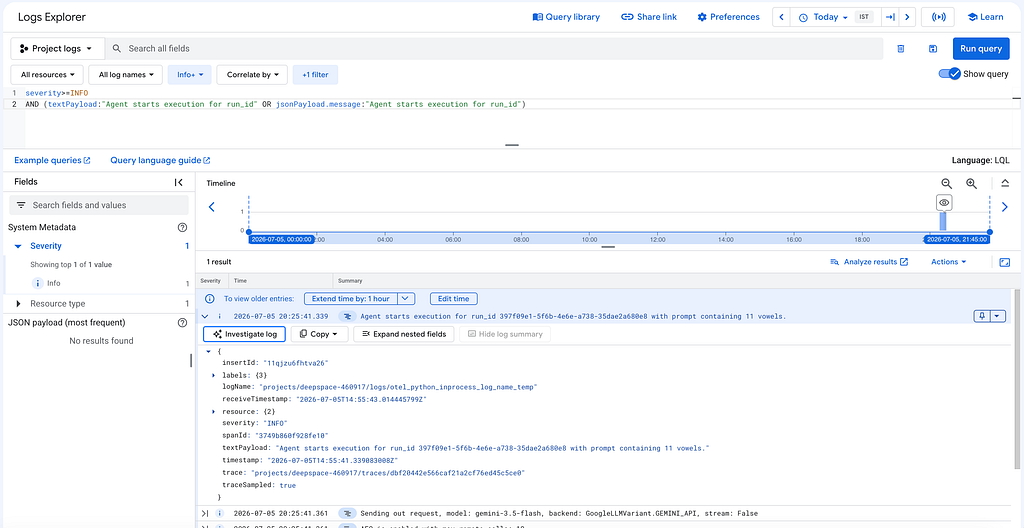
In the Logs Explorer, because OpenTelemetry automatically links your log statements to the current active trace context, you can seamlessly drill down into specific transaction flows.
#LQL
severity>=INFO
AND (textPayload:"Agent starts execution for run_id" OR jsonPayload.message:"Agent starts execution for run_id")
Conclusion
Instrumenting your LLM applications with OpenTelemetry transforms a “black box” agent into a highly observable, production-ready system. By leveraging the patterns in the shubhamgoogle/gcp-opentelemetry-llm-agent repository, you can seamlessly route standard and custom metrics, traces, and logs to Google Cloud Observability, allowing you to monitor costs, optimize token usage, and rapidly debug complex AI reasoning loops.
Mastering Observability in Google ADK: Implementing OpenTelemetry for GCP Metrics, Traces, and… was originally published in Google Cloud – Community on Medium, where people are continuing the conversation by highlighting and responding to this story.
Source Credit: https://medium.com/google-cloud/mastering-observability-in-google-adk-implementing-opentelemetry-for-gcp-metrics-traces-and-cf5422256633?source=rss—-e52cf94d98af—4
About the Author