Every data catalog I’ve used is good at telling me what exists and bad at telling me what to use.
It knows a table exists, who owns it, when it last refreshed, which 47 columns it has. What it can’t do is answer the question I actually showed up with: which table, which join, which filter, for this question, for this person. So I close the tab and go ask someone on Slack, which is the exact thing the catalog was meant to save me from.
I spent the winter building something about it. Partly because the problem annoys me, partly as an experiment: I wanted to see whether a coding agent could put together a real system if I stayed disciplined about the architecture and didn’t let it wander. So I set the direction, made the structural calls, reviewed what came back, and the agent wrote effectively all of the code. Six extraction plugins, a graph store, a REST API, a React explorer, a couple of thousand tests. Verdict at the bottom.
It isn’t a new catalog. It sits on top of the ones I already had. BigQuery knows the schemas and the storage stats, dbt knows the transformations and the tests and, if you’ve bothered with the semantic layer dbt and looker have the metric definitions, Knowledge Catalog (once know as Dataplex) knows the glossary and the owners. Every bit of that is true and useful and stuck in its own tool, which is why none of it helps much when I’m trying to answer one question.
Ten things it does that I always wanted from a catalog. Everything below comes from one dbt project, modern_saas_analytics: a SaaS revenue warehouse with six tables that have “revenue” in the name, a customer that exists three times in three systems, and a glossary nobody has opened in months.
1. Let me talk to my metadata
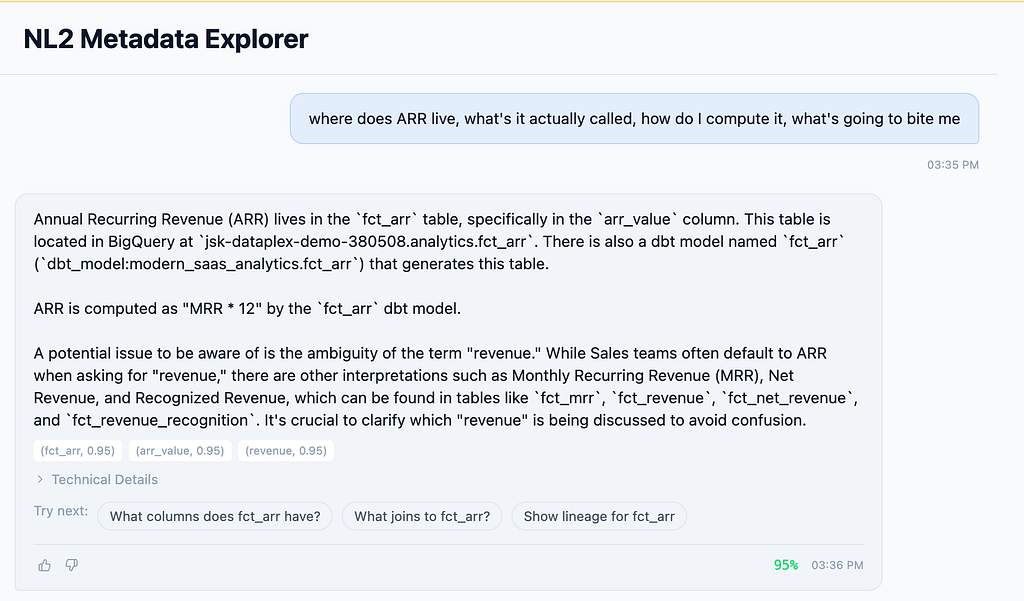
Everyone is building “talk to your data” right now. I wanted the same thing one level up, pointed at the metadata rather than the rows. Not “what was ARR last quarter” but “where does ARR live, what’s it actually called, how do I compute it, what’s going to bite me”.
Search doesn’t get you there. My project has six tables with “revenue” in the name and search returns all six in some order with no opinion about any of them. Meanwhile the glossary has an entry for ARR that says, in plain English, “Always use fct_arr, NOT mrr × 12.” The catalog stores that sentence and can’t do anything with it.
So the agent goes off and collects metadata roughly the way an analyst would. Search a bit, read the glossary, check what connects to what, look at what people actually query. What comes back is a context package, which is the idea the whole thing turns on. The closest thing I can compare it to is a briefing. For the ARR question that’s the right table, three columns out of 47, the join to dim_customers, the metric expression lifted out of the dbt semantic layer, and the glossary warning that kept it off fct_mrr. All of those facts were already written down somewhere. Nothing had ever put them on the same page.
I went back and forth on whether this needed an agent at all, and the glossary line is what settled it. A relevance score can’t follow “NOT mrr × 12”. It sees numbers, applies a cutoff, and drops the correct table because “annual recurring revenue” appears nowhere in the string fct_arr. You need something that can read the sentence.
The follow-ups ended up mattering more than the first answer. Which of these is fresher, how do I exclude refunds, who owns this. That’s most of what I use it for.
2. Turn my question into an actual query
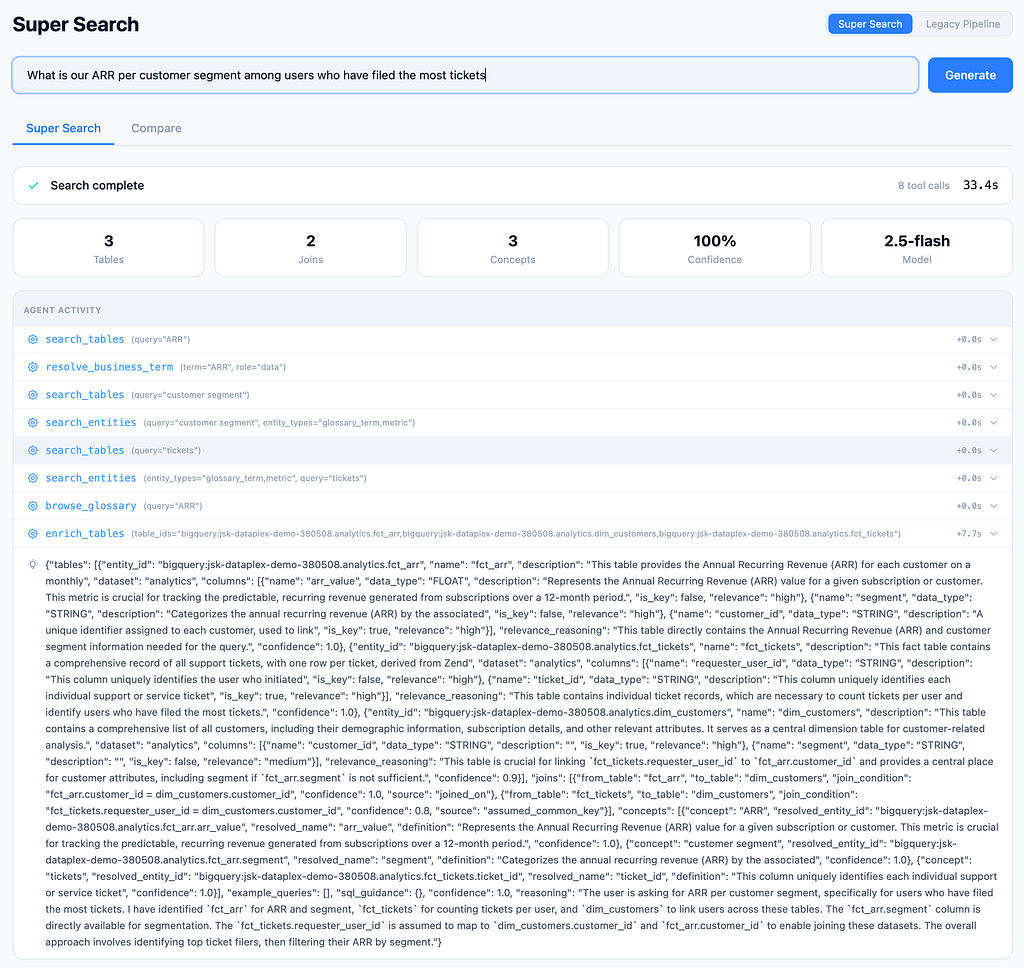
Knowing the table is maybe half the job. I still have to write the SQL, and the part I get wrong is never the SELECT, it’s the joins and whatever definitional trap someone hit eighteen months ago and wrote down nowhere.
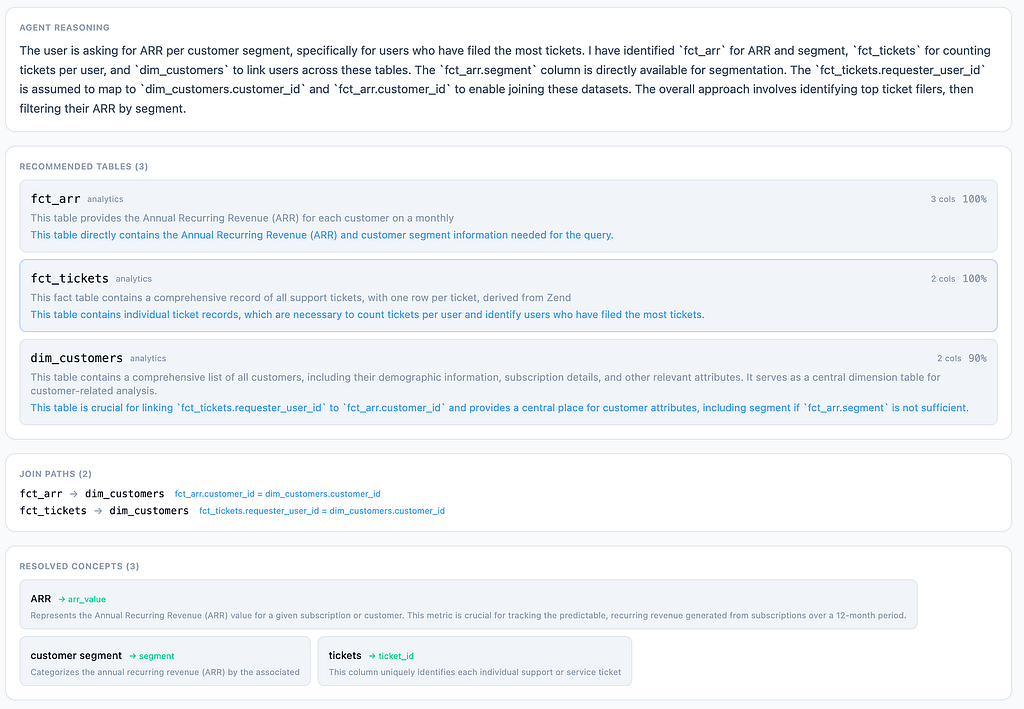
So the same context package gets projected into whatever shape a query generator needs: join conditions as real ON clauses, the metric expression, the filters that go with my role, a couple of old queries to crib from.
The joins are the part I’d point at. They come out of query log analysis and get stored as edges with a frequency count, so fct_arr.customer_id = dim_customers.customer_id isn’t a guess based on two columns having the same name. It’s the join people run, over and over. Handing that to a generator rather than making it infer joins from a schema dump is most of the difference between SQL that runs and SQL that just looks like it should.
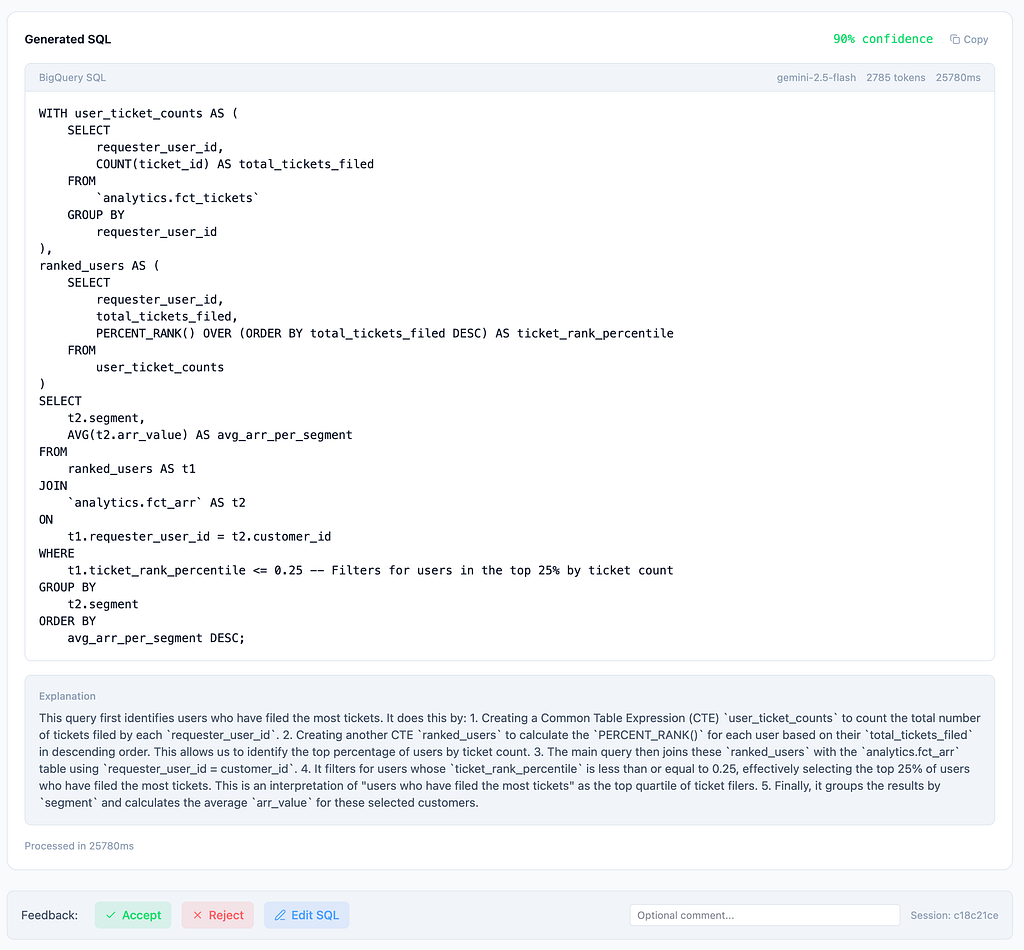
The metric expressions come out of dbt’s semantic layer, where there is one. If somebody has defined total_arr as a measure that sums arr_amount, that definition goes into the graph as its own entity and comes back out in the package, instead of being reinvented by a model having a good day. Derived and ratio metrics arrive with their inputs attached, so a question about net revenue retention gets the actual formula and the measures underneath it rather than something plausible. This is the metadata I trust most in the whole graph, because unlike lineage or usage patterns, a person sat down and wrote it deliberately.
3. Write its own descriptions, and publish them back
Nobody is going to document the 200 tables a pipeline created last month. I’m certainly not, and I’ve stopped pretending otherwise.
Every catalog has a description field and a permanent guilt trip attached to how empty it is. It can’t fill the field in itself because it doesn’t know what the table means, only what columns it has. And an LLM pointed at column names alone will write you something confident and wrong, which is worse than leaving it blank.
The difference here is what goes into the prompt. Descriptions get drafted from context pulled across the whole graph: the upstream lineage, the glossary terms attached to the table, how it actually gets queried, the columns it shares with its resolved siblings in other systems. That’s enough material to say what a table is for, not just what’s in it. Right-click a node in the graph, generate, read the draft along with a breakdown of what it was based on, accept or reject. I bulk-accept when they’re obviously fine, which they usually are for the boring staging tables and rarely are for anything with business logic in it.
Then it publishes back into BigQuery and Knowledge Catalog. That step took the longest to get right and it’s the one I’d keep if I had to drop the rest. Descriptions that only exist inside my tool would just be a fifth silo, and I have enough of those.
4. Feed my conversational agents on the fly
This came out of pointing Google’s Conversational Analytics at the warehouse and watching it flounder for reasons that had nothing to do with the model.
Those agents are only as good as the context you hand them. Give them all 400 tables and they drown. Hand-write a YAML context file for the agent instead and you’re maintaining a second semantic layer alongside the one already sitting in dbt, and it starts rotting the day somebody changes the warehouse. The material is all there, dbt’s definitions included. There’s just no way to get the right subset of it into a context window at the moment of the question.
So there’s one endpoint that returns the context package, and a projector so each consumer takes only the parts it wants. Conversational Analytics asks for schema, semantic layer and sample queries. Something else asks for join paths and filters. Same graph, different cuts.
Assembly runs the graph traversal and the embedding search at the same time and merges them, which catches tables a keyword walk misses. Every entry records how it got there. I added that for debugging and now read it constantly.
5. Plug into any AI tool without writing glue
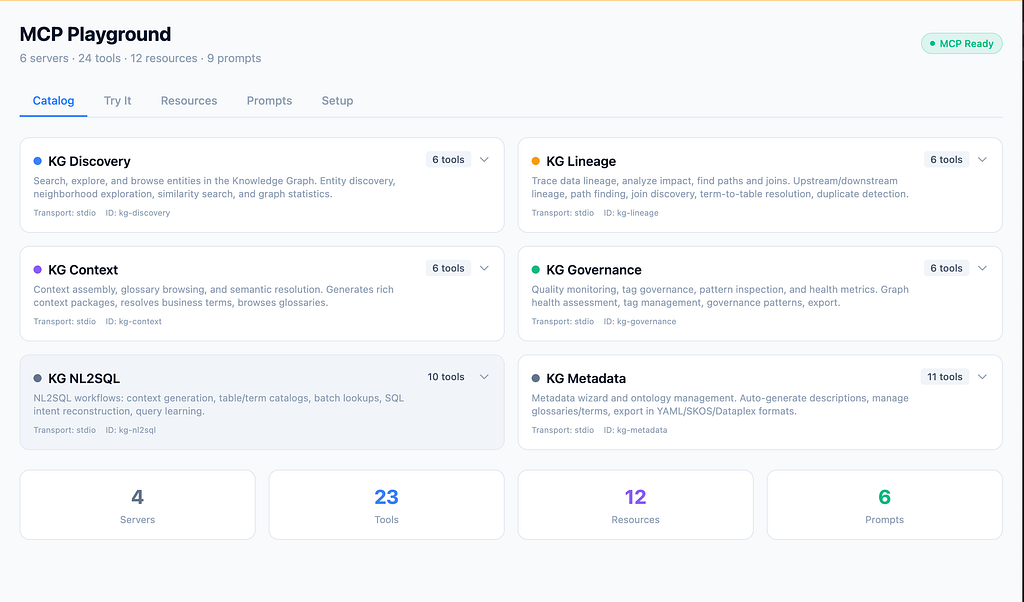
Small one, and the one I underestimated.
Catalogs ship a UI and a REST API. Getting either into an LLM agent means writing glue — endpoints into tool schemas, auth, reshaping responses — and then writing it again for the next agent.
Three MCP servers now cover context assembly, lineage and query context, so anything that speaks MCP picks them up as tools. There’s a playground in the explorer UI listing every tool with a live executor next to it. Started as a debugging aid, turned into the page I open first when something looks off.
6. Stop me before I build something that already exists
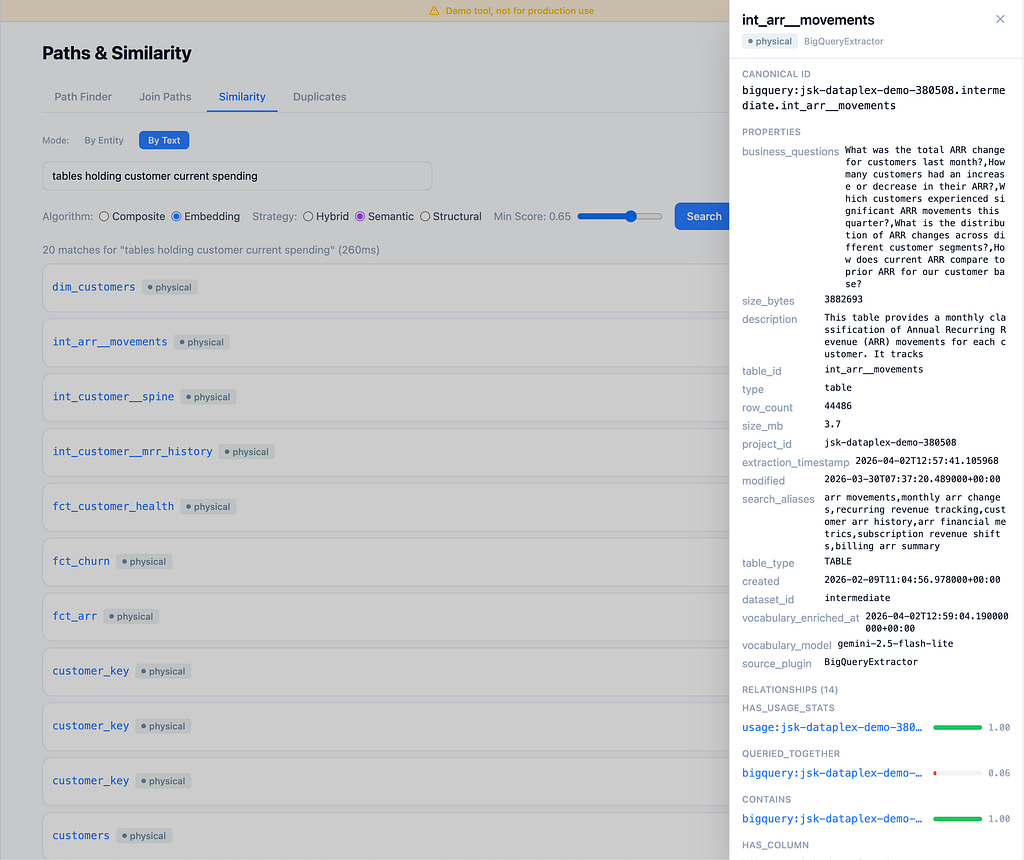
Before I write a new dbt model I’d like to be told that somebody already built it.
Keyword search won’t do that. Searching “churn” finds tables with “churn” in the name and misses customer_retention_monthly, which is precisely the model I was about to rebuild under a different name. Duplicate work hides behind vocabulary. Two engineers, two words for the same idea, and now a third person has to work out which one is right.
Every entity carries an embedding, so “customer churn model with monthly cohorts” matches customer_retention_monthly at around 85% with no shared keywords at all. What comes back is the near-duplicate, who owns it, how it differs — that one’s weekly, you want monthly — and a suggestion to extend it instead of forking it.
Easiest one to justify to anyone else, incidentally. The model you don’t build is the one you never have to maintain.
7. Find the join path
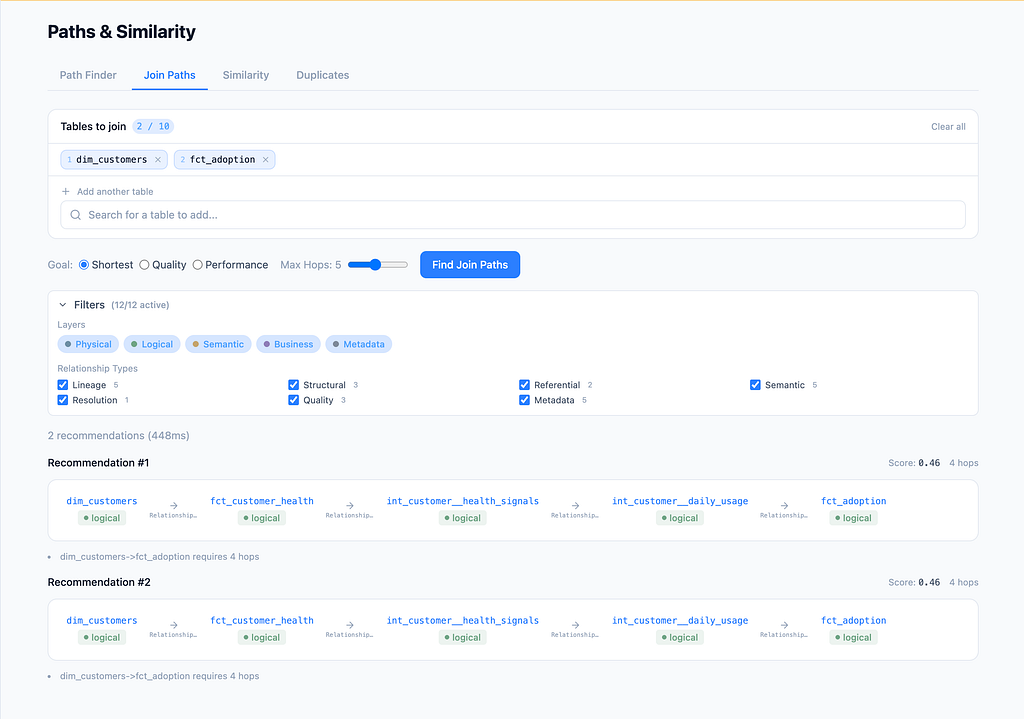
“How do I connect orders to support tickets” should come back with a join, not a lineage diagram I have to read like a subway map.
Lineage gives you A to B to C. It doesn’t give you the key, doesn’t tell you whether anyone actually travels that route, and falls apart as soon as the two tables live in different systems. Which they do: a dbt model here, a BigQuery table there, the same customer sitting in three catalogs under three different IDs.
Two things. Joins mined from query logs and kept as real edges with frequency and confidence, so the graph knows which joins people use rather than which ones are theoretically possible. And entity resolution that links the same thing across systems without merging the records, so each source keeps its own copy while the customer becomes one cluster you can walk through.
There’s a third source I didn’t plan for and now rely on. dbt semantic models declare their join keys outright, primary and foreign, and those land in the graph next to the observed ones. Where the declared key and the logs agree, I’m fairly confident. Where people are repeatedly joining on something nobody declared, that’s usually worth going and looking at, and once or twice it’s been a bug.
The pathfinder also had to learn to ignore structural edges, containment and so on. That took a couple of goes. The first version would route between two tables via “this table contains this column” and present it as a finding.
8. Tell me where a business term actually lives

Someone asks for Annual Recurring Revenue. Where is that, concretely, in a warehouse with six revenue tables?
The glossary lives in one tool and the tables live in another. The glossary tells you what ARR means and never tells you which column implements it. The bridge between them is a person who happens to know, and that person is on holiday.
Terms now have edges down to the columns that implement them, and where a dbt semantic layer exists it supplies the middle of that chain. Resolving “ARR” walks from the glossary entry to the total_arr metric, from there to the measure the metric is built on, and from the measure’s expression down to fct_arr.arr_amount. Every hop is something a person wrote down on purpose, in a different tool, for a different reason, and none of them knew about the others. Stitching them together is what makes the answer worth trusting. I’m not inferring that this column is ARR from its name, I’m following a definition somebody committed.
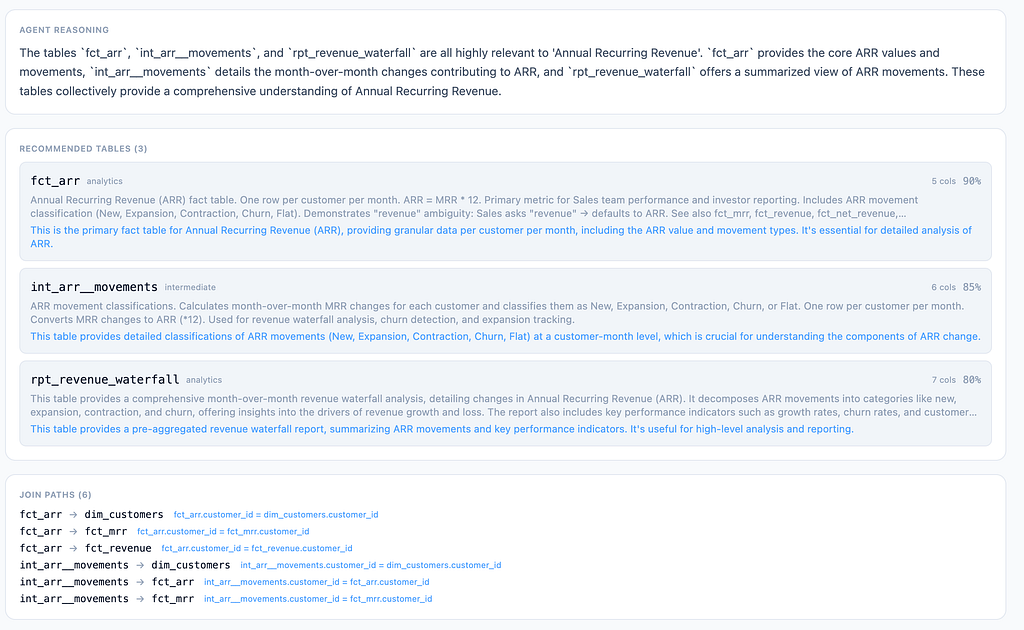
Synonym extraction means “recurring revenue” and “ARR” and the full phrase all land in the same place, and none of those strings appear in the table name. Where there’s no metric defined, it falls back to matching the term against columns directly, which works but with visibly less confidence attached.
It works in both directions, which I didn’t expect to care about. Going from some unfamiliar column back to the business concept is how I use it most days.
9. Rank tables by quality and cost, not by name
Don’t just list the six tables with “revenue” in the name. Tell me which one is fresh, tested and cheap to query, and steer me away from the one that looks right and isn’t.
Catalog search ranks on name match. It has no opinion about the fact that one candidate hasn’t refreshed since Tuesday, another has two failing tests, and querying the raw fact table scans 2 TB when a partitioned daily aggregate would answer the same question for pennies. All of that is recorded somewhere. None of it reaches the ranking.
Scoring now pulls from all of it: freshness, partitioning and size from storage; test results and how many people depend on the table from the quality side; whether anyone owns it from the business side; and whether the schema covers the dimensions I asked about. For “daily revenue by product and region” it lands on the pre-aggregated partitioned table other people already use, and flags the obvious keyword match as stale.
You can’t make that call from any one of those sources alone, which is more or less why they’re all in the same graph.
10. Answer differently for Finance and for Sales
“Top performing products last month” means revenue to a Finance director and units in their own region to a Sales manager, and neither of them is going to say so out loud.
A catalog has one description per table for everybody. Revenue means net margin to Finance, closed-won pipeline to Sales, campaign ROI to Marketing, so picking one canonical answer means being wrong for most of the company.
Assembly is therefore role-aware. Six roles, each with its own vocabulary, boosting what matters to them. Ask about ARR as Finance and the revenue tables come first with is_refunded = false attached; ask the same words as Sales and you get a different table and a different filter.
Since the conversation, the SQL and the agent context all come out of the same assembly step, this quietly threads through everything above.
Where it falls down
The graph I’ve been describing has a few hundred entities and a few thousand relationships. That’s a real dbt project rather than a toy, but it isn’t a Fortune 500 warehouse either, and I genuinely don’t know which of this survives a hundred thousand tables. Entity resolution worries me most, since name collisions get much worse as the space fills up.
The agent is slower than a lookup. Seconds, not milliseconds. Fine for assembling context, not fine for anything interactive, so there’s still a fast keyword path sitting next to the clever one and I doubt that changes.
And it inherits whatever your metadata already is. Empty glossary, nothing tested, nothing owned, and a graph over that is a nicer way to look at the gaps. It rewards teams who have already done some of the work, which is an uncomfortable thing to admit about a tool meant to reduce work.
The verdict on the experiment
What I wanted wasn’t about getting metadata, it was something that joins across the boxes and assembles context one question at a time.
That includes the semantic layer rather than competing with it, which is a distinction I only got straight halfway through. Looker metrics metrics are the most carefully thought-through metadata most teams own, and they also cover a small slice of the warehouse, because somebody has to sit down and define each one and nobody ever finishes. Pulling them into the graph lets the defined parts stay authoritative while lineage, usage and glossary links cover the rest, which would otherwise just be a blank.
On whether a coding agent can build a real system: mostly yes, with a caveat I keep chewing on. It wrote the extraction plugins and the traversal algorithms quickly and well, better than I’d have managed on a Tuesday evening. But the decisions that determined whether any of it was worth using were made before much code existed. Link entities instead of merging them. Put usage patterns in the graph as edges rather than scores. Return a context package rather than a ranked list. I could have had all that code written twice as fast and still finished with something nobody wanted to open. So I’m not sure this proves what these experiments usually get claimed to prove. Writing the code was never the part that was slow.
Next is closing the loop, so the graph learns from the answers people actually end up using. That’s the eleventh thing I wish my data catalog could do, and I haven’t built it yet.
P.S. Since i wrote this little experimental tool and the time of this Article is published Knowledge Catalog released some of the items already including join paths. Excited to see what comes next and to see my list be completed!
P.S.2 Should i opensource the code? Let me know
10 Things I Wish My Data Catalog Could Do was originally published in Google Cloud – Community on Medium, where people are continuing the conversation by highlighting and responding to this story.
Source Credit: https://medium.com/google-cloud/10-things-i-wish-my-data-catalog-could-do-550afb3c30af?source=rss—-e52cf94d98af—4
About the Author